🚀 New Feature: Dividend DRIP Returns! 🌱💰 |
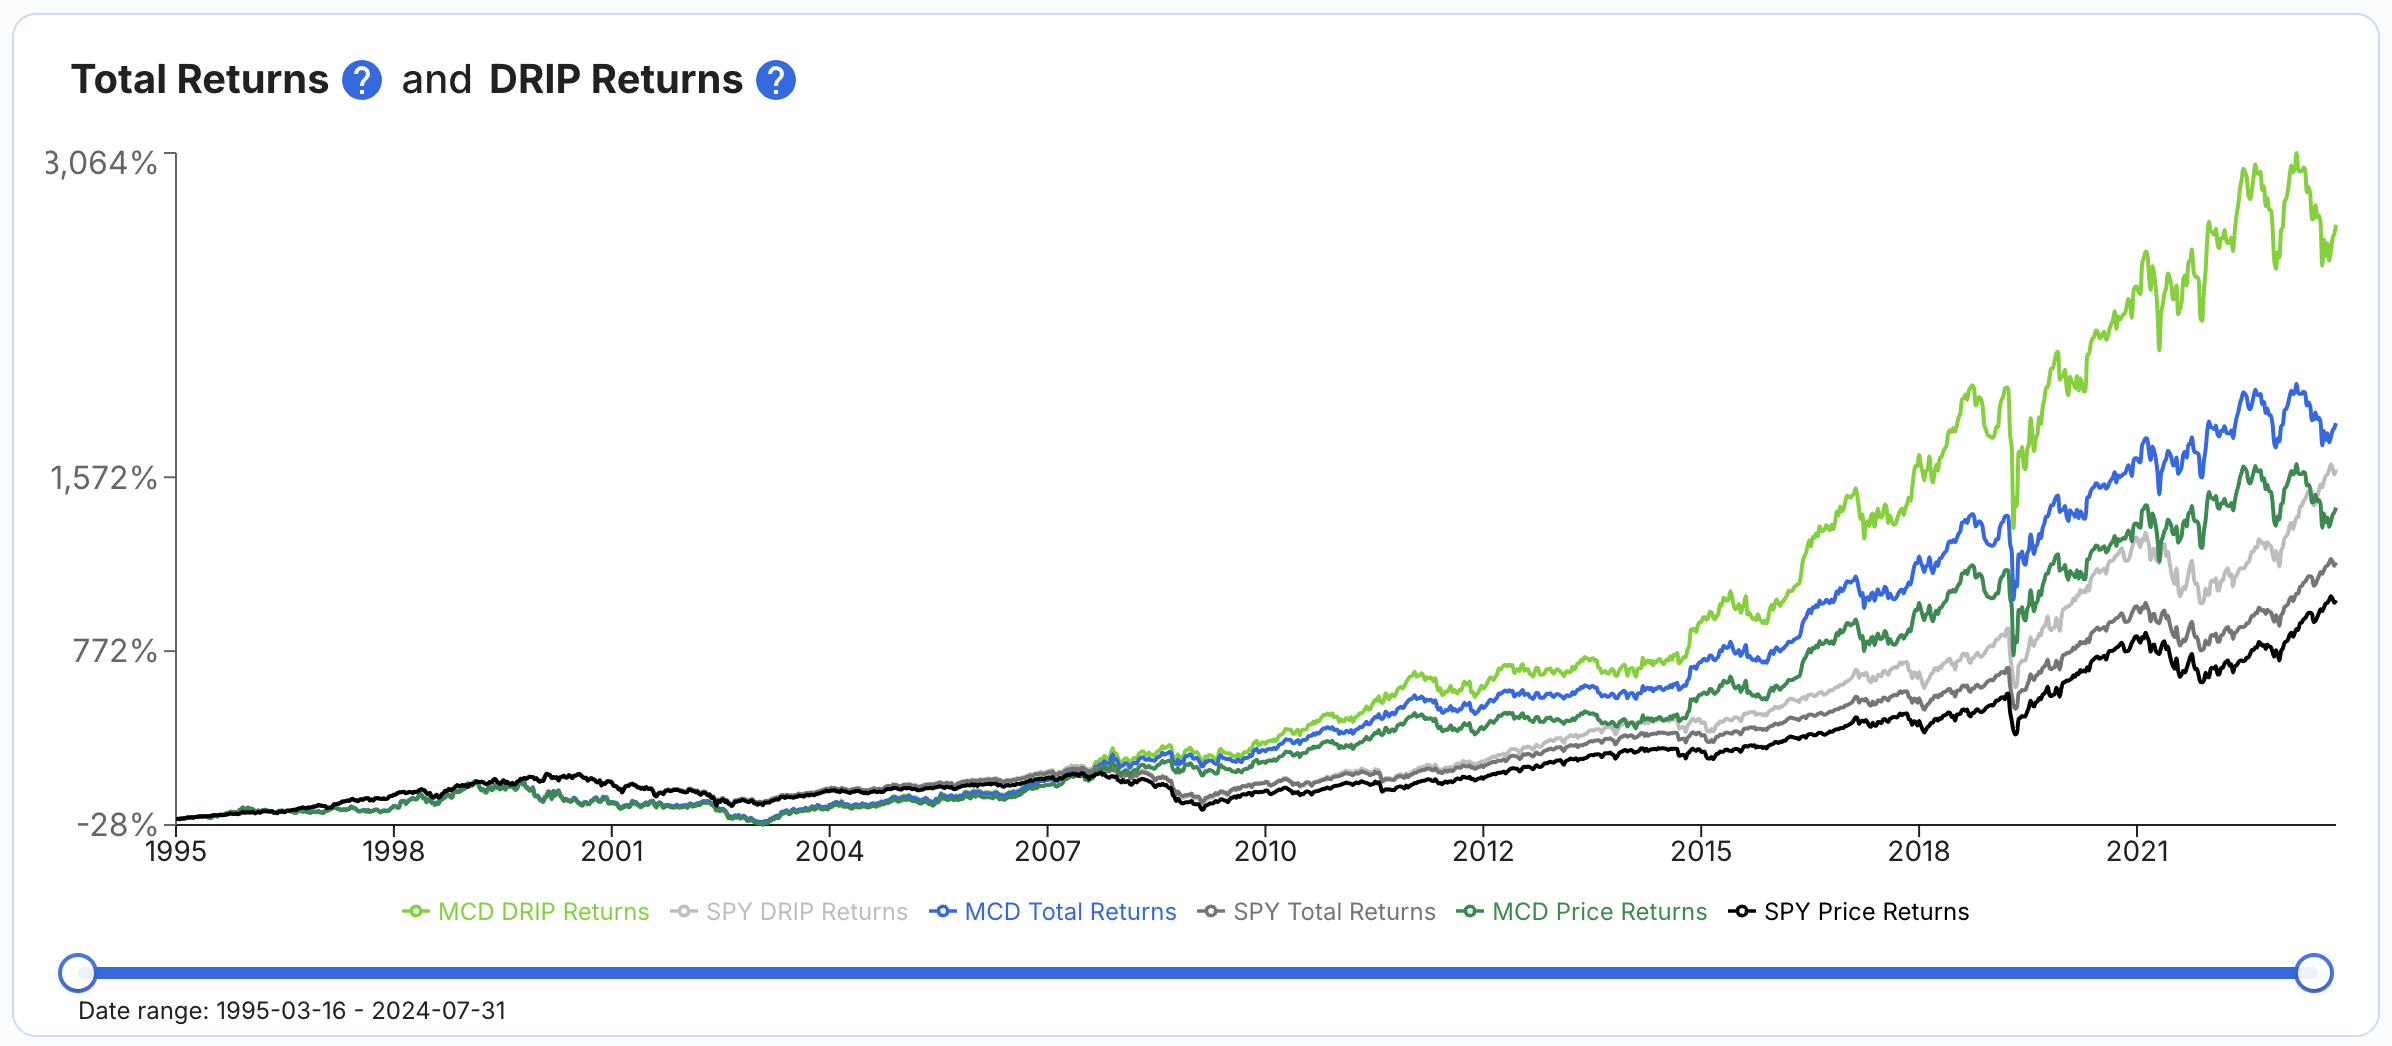
We've added DRIP (Dividend Reinvestment Plan) Returns to all stock & ETF dividend analysis pages!
• See how reinvesting dividends boosts your returns, in addition to the Total Returns line
• Perfect for dividend newbies and pros alike
• Check out the ? education definition to learn more about it!
Check it out now: https://stockunlock.com/stockDetails/MCD/dividends
This feature has been HIGHLY requested by all of you, and we are excited to continue to deliver you more value every week. |
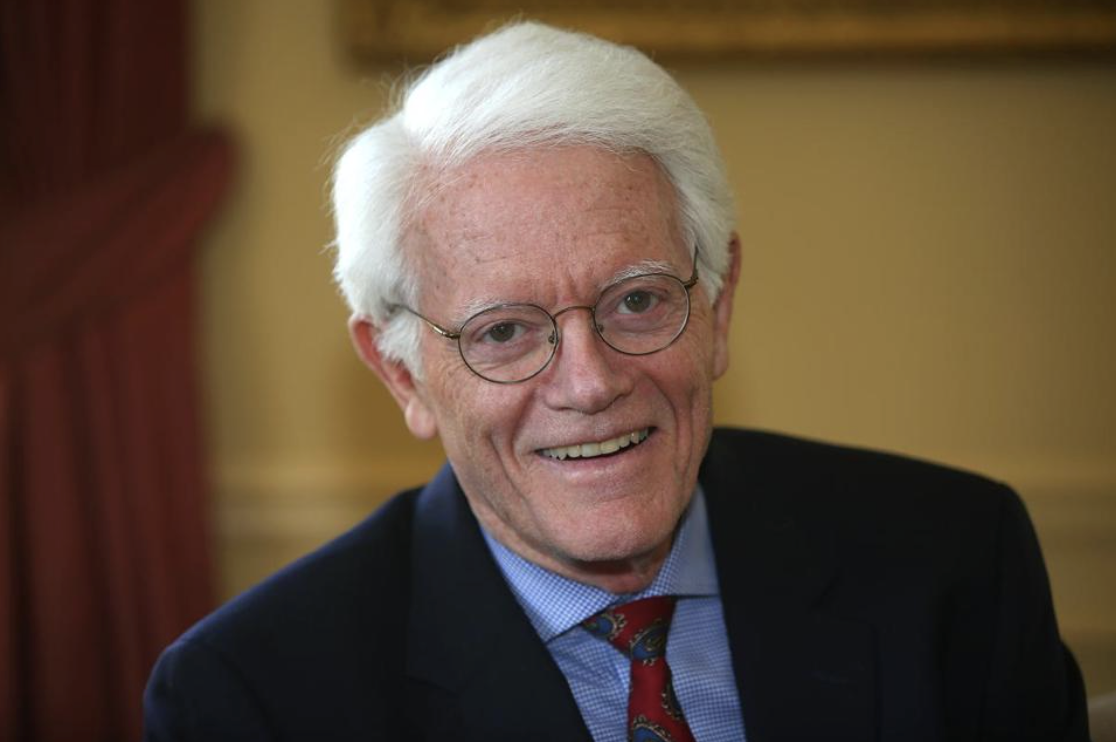
How Peter Lynch Achieved 29% Annual Returns Over 13 Years |
Peter Lynch is one of the most successful fund managers in the history of finance. He managed Fidelity's Magellan Fund from 1977 to 1990, and achieved an amazing annual average return of 29.2%. His investment style was simple, based on common sense and good research rather than complex theory. Today, we’re discussing Lynch's investment strategy.
|
According to Peter Lynch, individual investors can achieve great success by investing in what they know. They have an edge over institutional investors because they can see promising opportunities from their daily lives, well before these companies come onto the radar of Wall Street analysts.
For example, if you’ve been a golf player for 20 years, you know more about the golfing industry than 99% of people. Peter Lynch would advise you to stay within this circle of competence and consider investing in companies within the golfing sector.
Lynch's method of picking stocks was methodical and research-based. The companies he invested in should have a strong business model, and be easy to understand.
As he puts it: "If you don't understand a company, if you can't explain it to a 10-year-old in 2 minutes or less, don't own it."
This approach helped him: 1) stay away from complex business models that he couldn’t fully understand, and 2) take advantage of opportunities for simple businesses trading at a great price.
For instance, Peter Lynch invested in Dunkin’ Donuts in the late 1980s. He saw the potential for growth and believed the management team could successfully execute their plans. Dunkin' Brands turned out to be a great investment. |
The Categorization of Stocks |
Peter Lynch divides stocks into six different categories based on this method. This model gives investors a framework to analyze the nature and potential of various types of companies: -
Slow Growers: Large, mature companies with slow earnings growth of 2-4% annually. They often pay high dividends and are typically not volatile.
- Stalwarts: Mid-size companies growing at average annual rates of about 10-12%. They offer both moderate growth potential and are relatively stable investments.
- Fast Growers: Smaller companies with strong earnings growth of 20-25% or more. They create high risk/high reward investments.
- Cyclicals: Companies whose earnings are highly sensitive to economic cycles. These companies can offer high returns during economic upswings, but may suffer during downturns.
- Turnarounds: Companies that are struggling but have the potential to recover. The goal is to identify them just before they fix their issues. These stocks can be very rewarding if the turnaround is successful.
-
Asset Plays: Companies whose valuable assets are not fully reflected in their stock price. These assets could be real estate, natural resources, or undervalued subsidiaries.
Depending on your profile and your risk appetite, you can choose the category you prefer, and invest in these situations. Or you can diversify your portfolio by investing in all these categories. That’s what Peter Lynch did, and it worked well. |
Peter Lynch was a firm believer in fundamental analysis. He thought that a good investor should understand the complete scenario of a company in terms of its business model, financial health, management quality, and competitive position before investing in it.
Here are the main fundamental metrics Lynch focused on: -
Earnings Growth: Lynch searched for companies with strong, consistent earnings growth. He believed earnings growth was the primary mover of stock prices over time. And it’s true that there is a correlation between Earnings Per Share (EPS) and stock prices in the long term.
-
Price/Earnings (P/E) Ratio: Lynch used the P/E ratio to determine whether a stock was overvalued or undervalued. He preferred stocks with low P/E ratios relative to their growth rates, often using the Price/Earnings to Growth (PEG) ratio to find attractive investments. The PEG ratio is calculated by dividing the P/E ratio by the company's earnings growth rate. A PEG ratio below 1.0 indicates that the stock is undervalued relative to its growth rate. For example, if a company has a P/E ratio of 15 and an expected annual earnings growth rate of 20%, its PEG ratio is 0.75 (0.75 = 15/20), which indicates an attractive valuation.
-
Debt Levels: Lynch favored companies with manageable debt levels. High debt is risky, particularly during an economic downturn, so he preferred companies with strong balance sheets (high cash reserves and low debt). With more than 50,000 public companies available, Lynch saw no reason to invest in heavily indebted companies that would struggle during a recession.
- Cash Flow: Positive cash flow is a sign of financial health. Lynch analyzed cash flow statements to ensure that companies could generate enough cash to fund operations and growth.
-
Management Quality: Having a great management team was critical to Lynch. He looked for managers with a clear vision, a successful track record, and a commitment to shareholder value.
These five criteria are great filters to identify great businesses. If you focus on these key metrics, you will be much more confident in your analysis and make better investing decisions. |
Peter Lynch's investment approach is simple: invest in what you know, choose profitable and growing businesses, and avoid companies with high debt. These principles remain relevant today and will continue to be relevant in the future. |
This Newsletter's Author
This newsletter was written by Christophe Nour. You can find him via YouTube, LinkedIn, view his portfolio on eToro, and join his online investing course on Skool.
Additionally, if you have any questions about this newsletter, you can send him an email at: christophe.nour@icloud.com |
Disclaimer:
Stock Unlock's newsletter is not a recommendation to buy or sell stocks. Stock Unlock does not provide financial advice, and we are writing this newsletter to help share ideas and teach you more about stock analysis. Please do not buy or sell stocks we discuss without doing your own research and/or consulting with a professional. |
Let us know if you have any feedback
In addition to providing education around investing fundamentals we are exploring adding value through sending our members stock ideas and analysis. Please let us know if you enjoy this type of newsletter or have any feedback. Let us know what you think by emailing support@stockunlock.com |
|
|
|