10 Stocks with Durable Recurring Revenues |
We recently covered the Rainwater Equity ETF and why fund manager Joseph Shaposhnik believes recurring revenue businesses are the place for investors to fish. In short, it comes down to two main ideas: Stocks are hard to predict, and recurring revenues make these businesses more predictable than the rest
Recurring revenues are usually a result of a competitively advantaged business, e.g., switching costs or intangible assets (e.g., regulatory capture, customer goodwill).
Today, we are looking into 10 businesses with recurring revenues. Some of these are the typical SaaS subscription model; others - such as trash collectors - are not the standard recurring revenue business most would consider.
Let’s dive in: Brought to you by: Stock Unlock. |
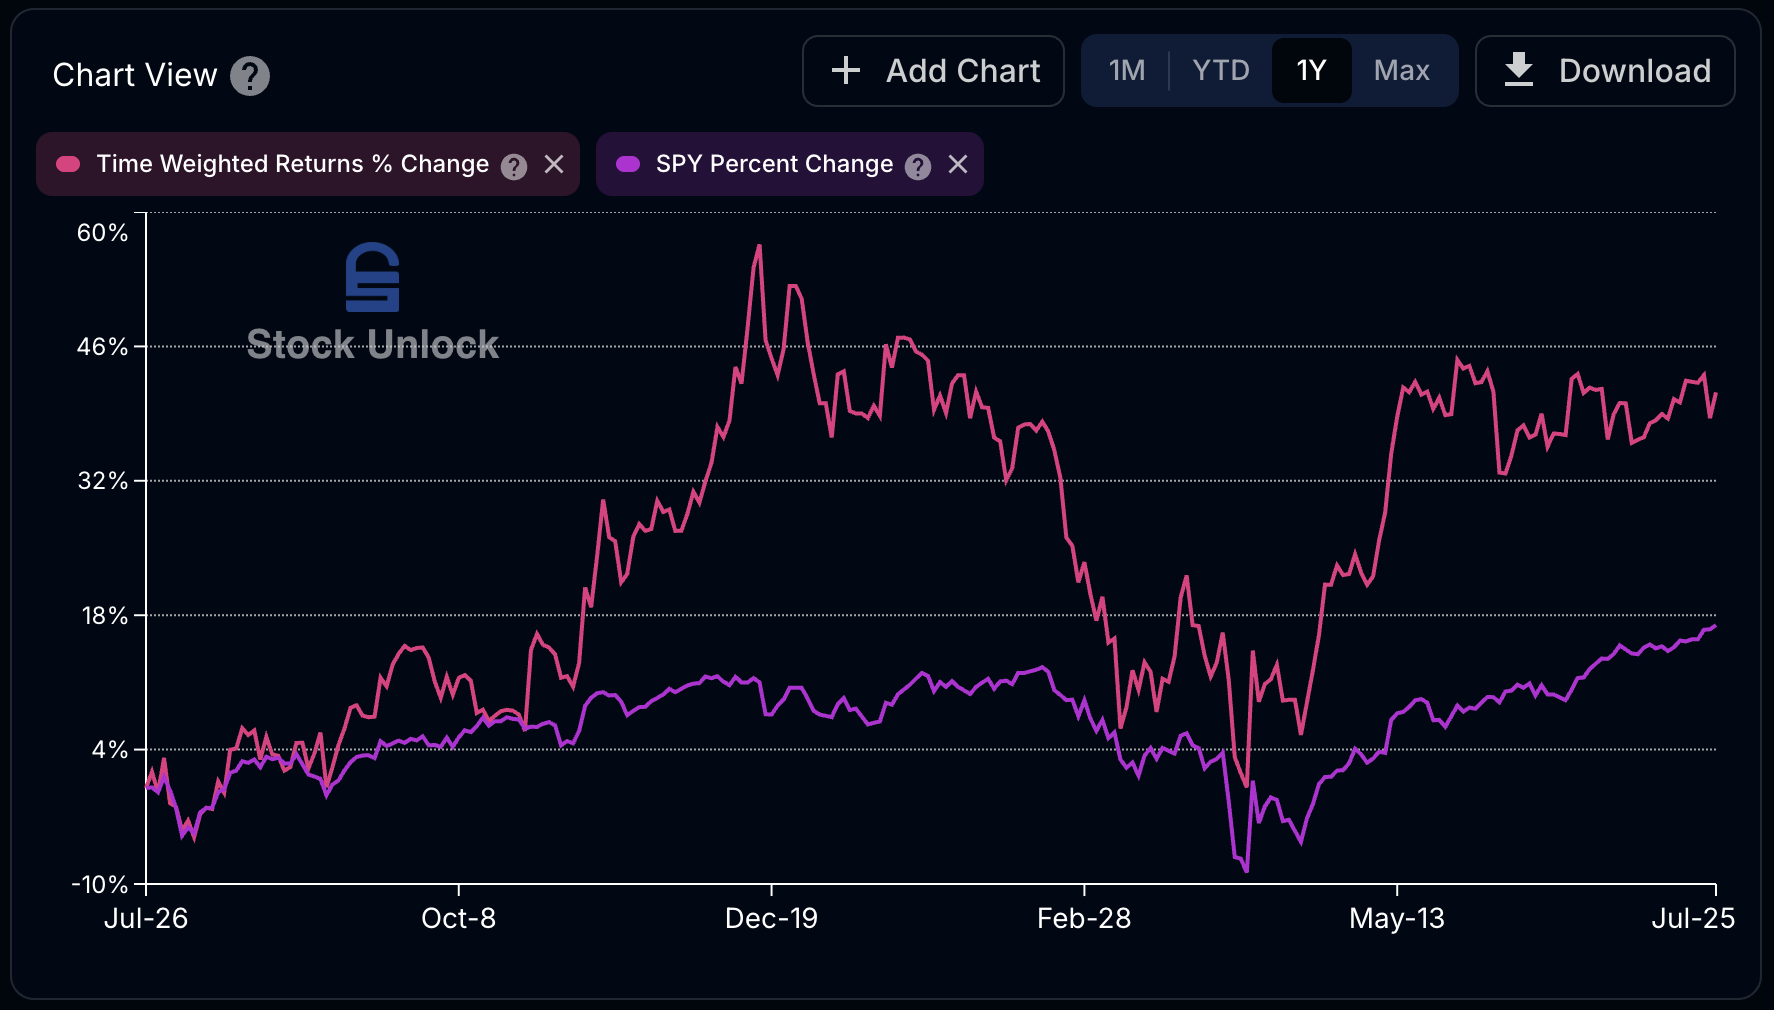
You can compare your portfolio’s Time Weighted Return directly to the SPY in Stock Unlock?
TWR is a powerful way to measure your true performance. It removes the noise of deposits and withdrawals, so you’re comparing apples to apples with the market. -
Time Weighted Returns % Change shows how your portfolio is performing based only on your investments, not when or how much you added.
- SPY Percent Change gives you a clean benchmark of how the S&P 500 has performed over the same period (without dividends).
This lets you answer the golden question: “Am I beating the market?” and actually trust the result. Try toggling both on your performance chart and see how your investing stacks up! |
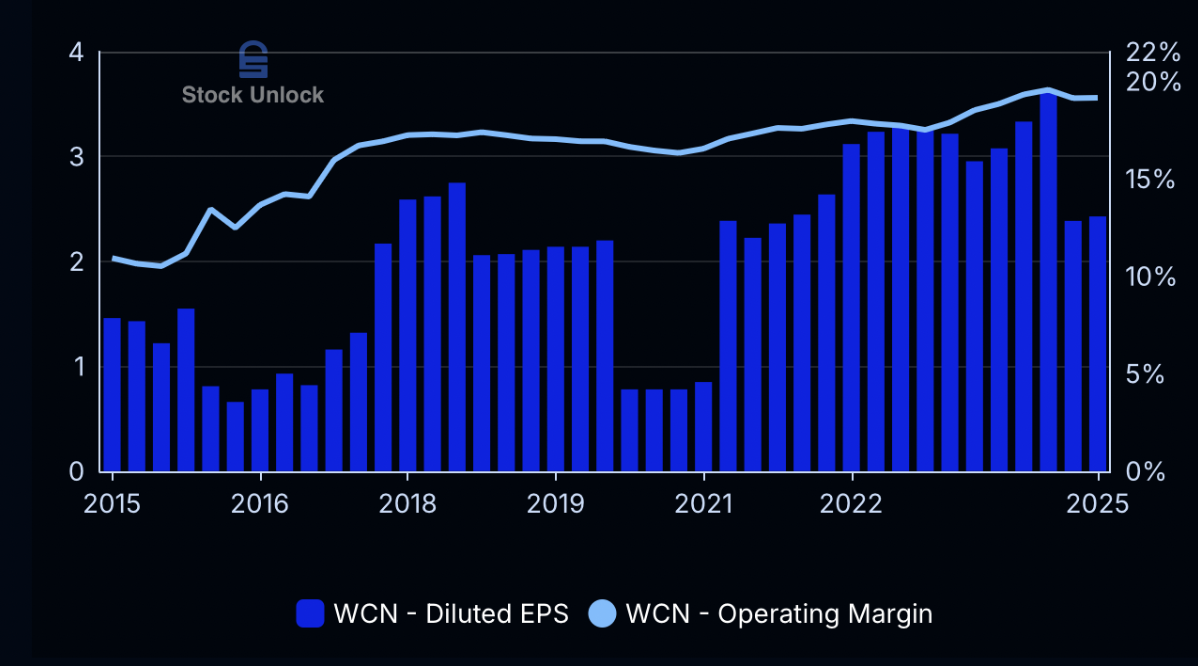
1. Waste Connections (WCN) |
|
|
Recurring Revenue Type: Long-Term Contracts
Revenue Growth (10-year CAGR): 16.3% Free Cash Flow Growth (10-year CAGR): 22.3% Forward P/E multiple: 31.6x If you look at most of Waste Connections’ investor material, the same few words are repeated - “value creation is linked to free cash flow per share growth.” That tells you all you need to know regarding management and capital allocation.
Part of the business model is to avoid competitive areas and focus on markets where it can be the sole provider. In most of these markets, Waste Connections has franchise agreements or contracts with municipalities that allow the company to make much better returns compared to areas where the low-cost provider typically wins. Since 2020, Waste Connections has made more than 100 acquisitions. The acquisitions mostly include private companies with high market shares in small areas.
As a result, Waste Connections earns industry-leading margins along with double-digit top line growth most years. The stock has also returned 17.4% annually (including dividends) since 2016. A fantastic example of a non-subscription-yet-recurring revenue business. |
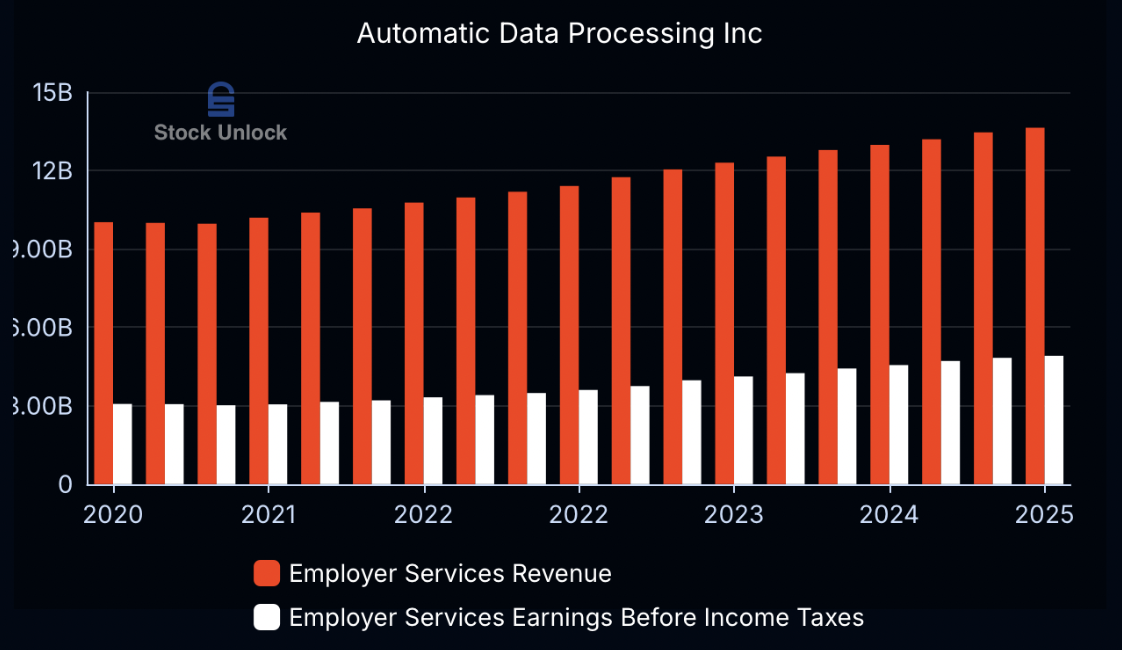
2. Automatic Data Processing (ADP) |
Recurring Revenue Type: Subscription Revenue Growth (10-year CAGR): 6.5%
Free Cash Flow Growth (10-year CAGR): 9.3% Forward P/E multiple: 27.3x ADP is one of those boring businesses that has carved a niche in its industry. Since starting out as one of the first companies to use computers in payroll processing in the 1960s, ADP has scaled to a $19 billion (FY24 revenue) business with clients across 140 countries. While the company does not disclose specific data on client retention, the number is in the high-90s for its global enterprise segment. That is exceptional. |
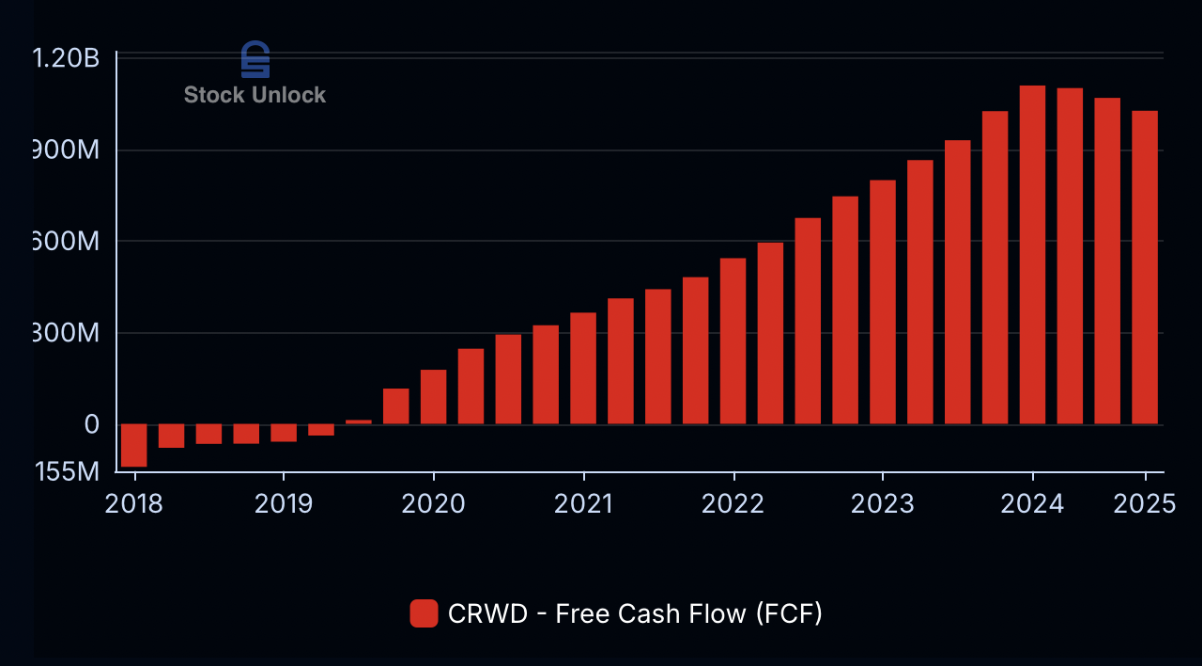
Recurring Revenue Type: SaaS Subscription Model Revenue Growth (5-year CAGR): 47.4% Free Cash Flow Growth (5-year CAGR): 44.7% Forward P/E multiple: 123x (not a typo!)
As opposed to Waste Connections, CrowdStrike is a much sexier business riding the tailwinds of increased demand for cyber security.
However, it has also executed the opportunity really well (despite last year’s outage that reportedly cost Delta Air Lines $500 million). In the most recent quarter, CrowdStrike ended with $4.4 billion in ARR (annualized recurring revenue) and 25% free cash flow margins.
Additionally, customers are increasingly adopting more modules from CrowdStrike’s Falcon platform. That creates stickier revenue and higher revenues per customer. No wonder the stock has compounded at ~35% annually since 2020. |
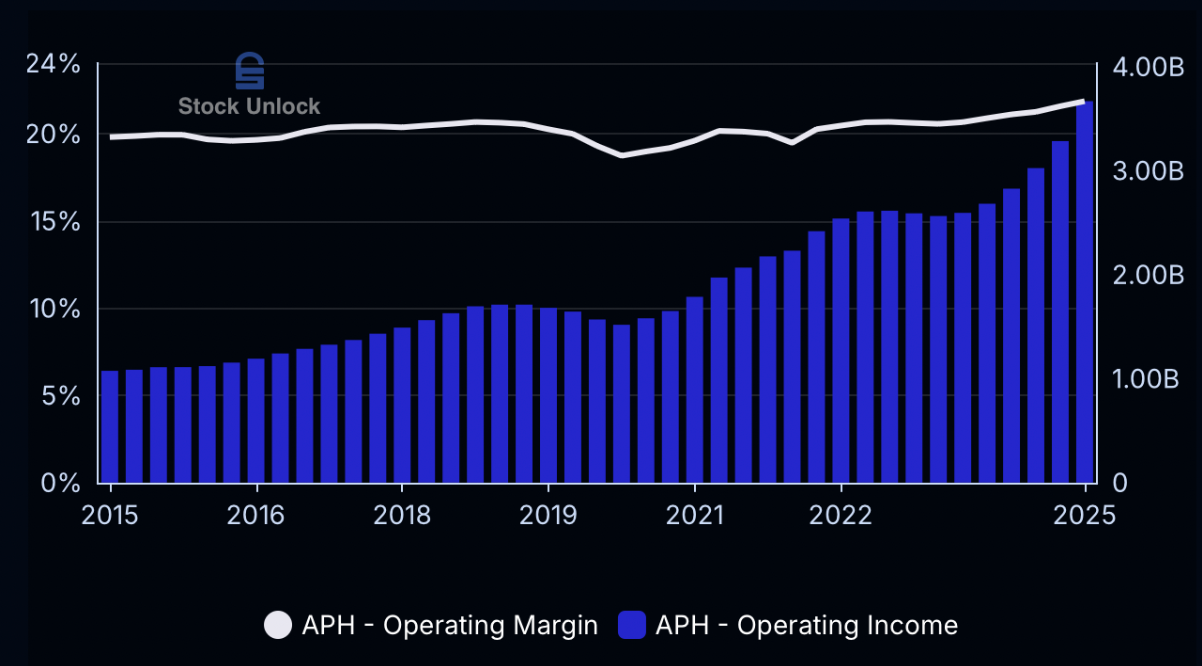
Recurring Revenue Type: Installed Base Revenue Growth (10-year CAGR): 11.9% Free Cash Flow Growth (10-year CAGR): 12.7% Forward P/E multiple: 38.4x
Amphenol is one of those quiet compounders you might not have heard about. Since January 2000, the stock has compounded at more than 20% annually.
In short, Amphenol sells electronic equipment such as antennas and sensors to a variety of industries. Through disciplined M&A, Amphenol has acquired more than 50 companies over the past decade across automotive, defense and datacom markets, among others. That makes the business less cyclical. The real switching costs come from the unique designs in Amphenol’s products - replacing the parts with ones from a competitor would require changing the whole system. In many cases, Amphenol is also the low-cost provider. Providing the hardware also allows Amphenol to do maintenance and replacements, segments that are typically more recurring and higher-margin. |
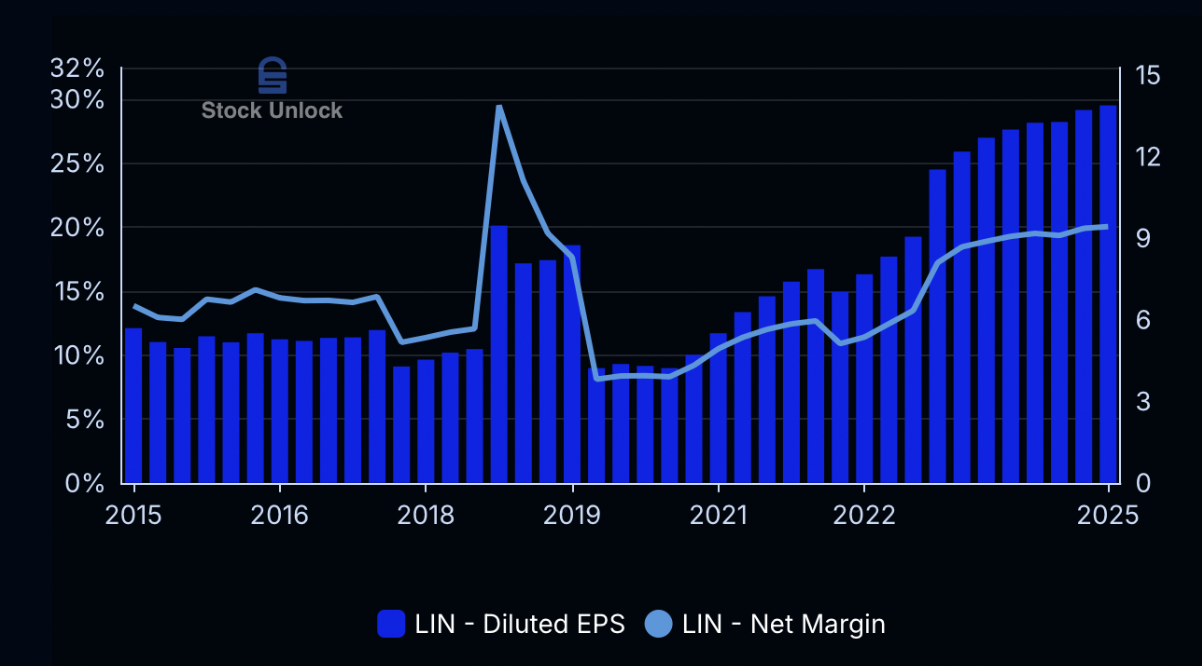
Recurring Revenue Type: Long-Term Contracts Revenue Growth (10-year CAGR): 10.6% Free Cash Flow Growth (10-year CAGR): 15.6%
Forward P/E multiple: 27.2x Linde distributes industrial gases such as oxygen and nitrogen to a wide range of industries, including health care, energy and food producers. The company goes all the way back to 1879. In an industry where product reliability and safety are critical, the customer relationships Linde has built through the years create huge barriers to entry.
While contract lengths vary by end markets, some can be as long as 15-20 years. Contracts of these lengths typically include a clause that lets Linde pass through any cost increases in its supply chain, which allows it to earn the same margin across the duration of the contract.
On top of the recurring revenue, Linde also offers maintenance and safety checks. That creates another layer of recurring revenue. While this is a fairly mature business, 16% EPS growth over the past five years shows that management has multiple strings to play on in terms of price increases and cost efficiencies. |
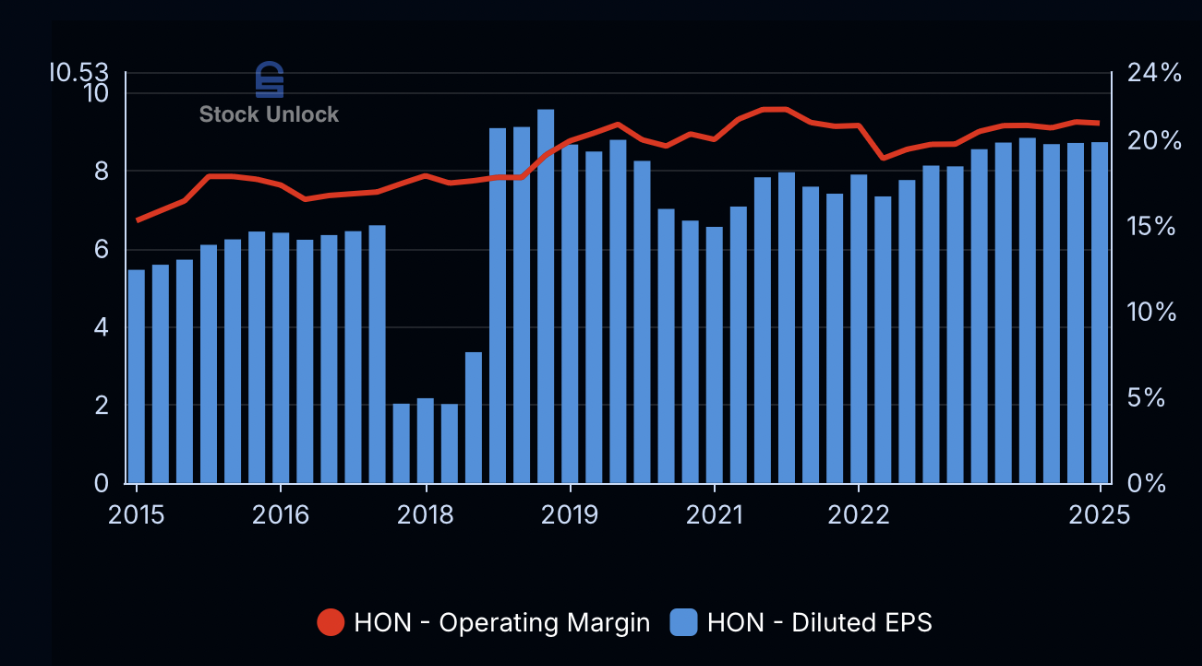
6. Honeywell International (HON) |
Recurring Revenue Type: Regulatory + Installed Base Revenue Growth (25-year CAGR): 1.9% Free Cash Flow Growth (25-year CAGR): 5.6%
Forward P/E multiple: 21.8x
Honeywell is a diversified industrial with a lot of moving parts. However, it has recently taken steps to optimize its portfolio to drive more recurring revenue at higher margins. That should be music to investors’ ears.
About 40% of sales (and 44% of profits) are from the aerospace industry. Selling aftermarket parts to a highly regulated industry such as aerospace and defense means high barriers to entry. Often, customers only have one or two suppliers of certain parts, which makes this a highly profitable segment. Further, Honeywell has an installed base of over 10 million units such as thermostats and HVAC equipment. In addition to the maintenance and parts replacement that drive recurring revenue, it also creates a lock-in effect with customers. As with Linde, there is a reason why many of these industrials are 100+ year-old businesses still thriving. Lastly, Honeywell has bought back around 2.3% of shares outstanding annually since 2017. These things combined - recurring, sticky revenue and capital returns to shareholders - make Honeywell a much more attractive business than at first glance. |
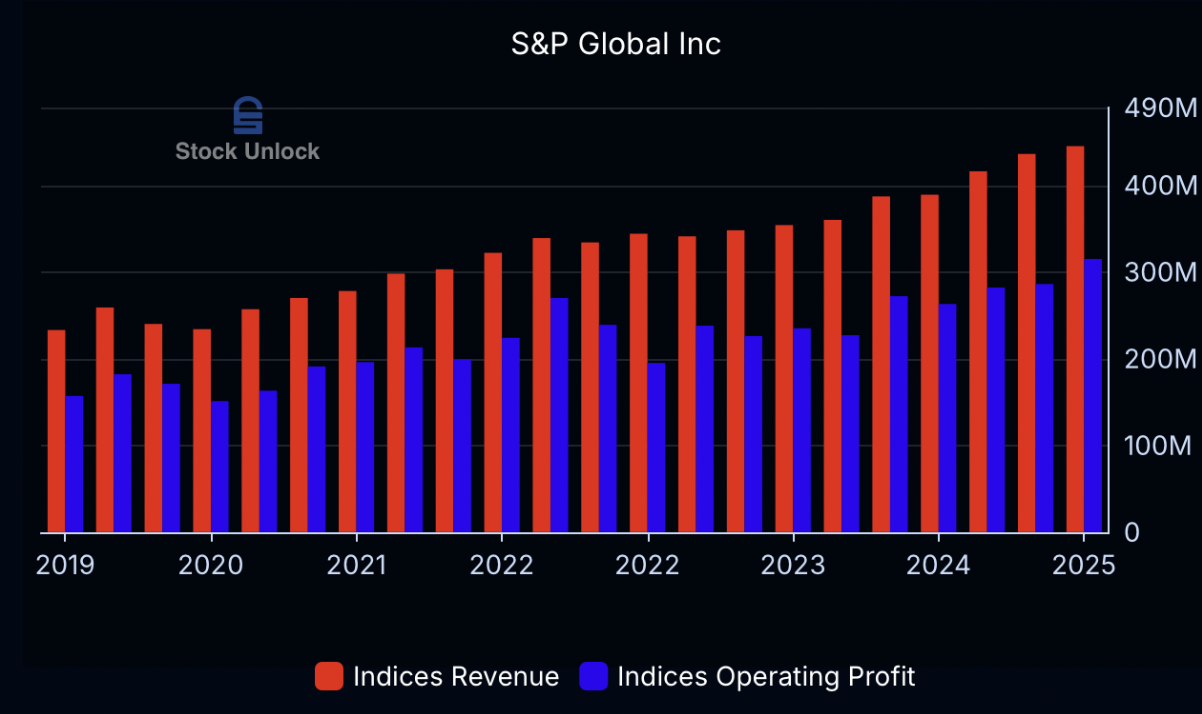
Recurring Revenue Type: Subscription Model Revenue Growth (10-year CAGR): 17.2%
Free Cash Flow Growth (10-year CAGR): 11.6% Forward P/E multiple: 27.9x
It’s hard to say whether S&P Global is most known for its ratings segment or its indices segment. Both are among the most competitively advantaged segments in the world with high margins and high recurring revenue.
For example, companies are essentially required to get a credit rating from one of the big issuers (Moody’s, S&P or Fitch) to get access to the best interest rates when raising debt.
Similarly, indices is just as sticky and recurring. Asset managers have to pay fees to continue to use the S&P-branded indices. Fees are typically based on AUM (assets under management), so this is a slowly but steadily growing at nearly 100% incremental margins. Financial institutions also pay subscription fees to get access to data. These two segments made up 42% of 2024 revenue, but 56% of profits. To illustrate, the indices segment earns EBITDA margins north of 70%. While the other segments are nice businesses, the world-class recurring revenue comes from the other two. |
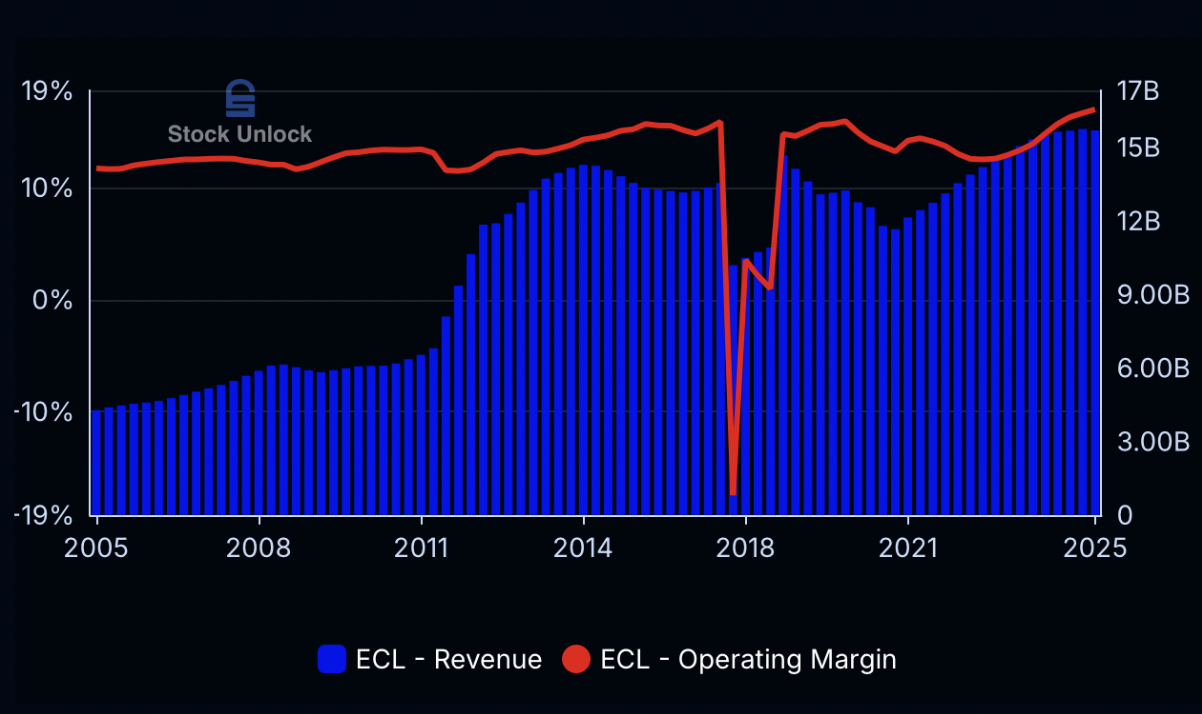
Recurring Revenue Type: Consumable Refills
Revenue Growth (20-year CAGR): 6.7% Free Cash Flow Growth (20-year CAGR): 9.1% Forward P/E multiple: 33.5x
Surprised to hear that Ecolab’s customers include Google, Disney and Starbucks? Most of Ecolab’s revenue is tied to water, including water treatment and sanitizing. With $16 billion in FY24 revenue and a $76.7 billion market cap, it’s one of those industrials that is “everywhere” yet fairly unknown.
90%+ of Ecolab’s revenue is from consumables. That means products such as chemicals and sanitizers that regularly need to be refilled in restaurants, hotels, and hospitals. There are also high switching costs for many customers because of reliability (Ecolab is a trusted supplier), hygiene standards, and in some cases regulatory framework that only allows customers to shop for an approved list of suppliers. In short - to Ecolab’s advantage - switching costs are higher than you would think at first glance. |
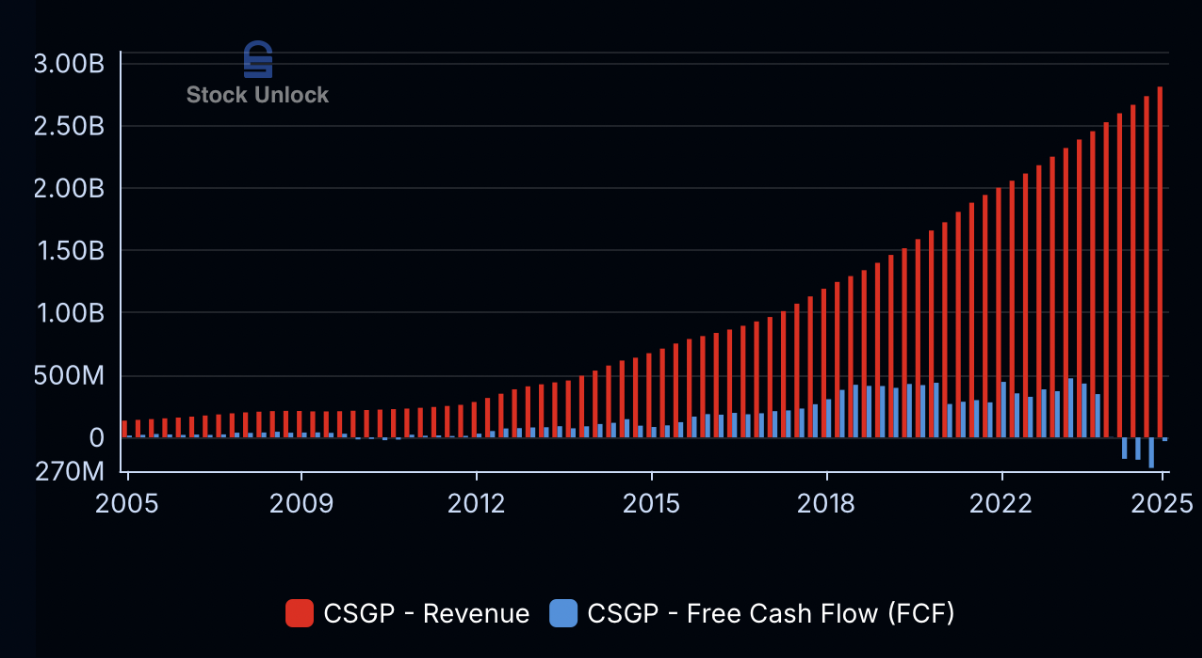
Recurring Revenue Type: Subscription Revenue Growth (10-year CAGR): 16.4%
Free Cash Flow Growth (10-year CAGR): Negative FCF in 2024 (Due To Acquisitions) Forward P/E multiple: 80.6x CoStar stock has compounded at 15% annually over the past decade and 16% annually over a 20-year timeframe. When a business outperforms the market over multiple decades, there is clearly some secret sauce that protects the company from competitors. As the owner of LoopNet, Apartments dot com, and Homes dot com, CoStar Group owns a huge amount of proprietary real estate data acquired over decades. That data is essential to landlords (in both commercial and residential markets), as evidenced by 96% subscription revenue and 89% renewal rates.
Because CoStar Group is the leading provider of real estate data, there are also network effects protecting the business because more listings lead to more users (and vice versa). |
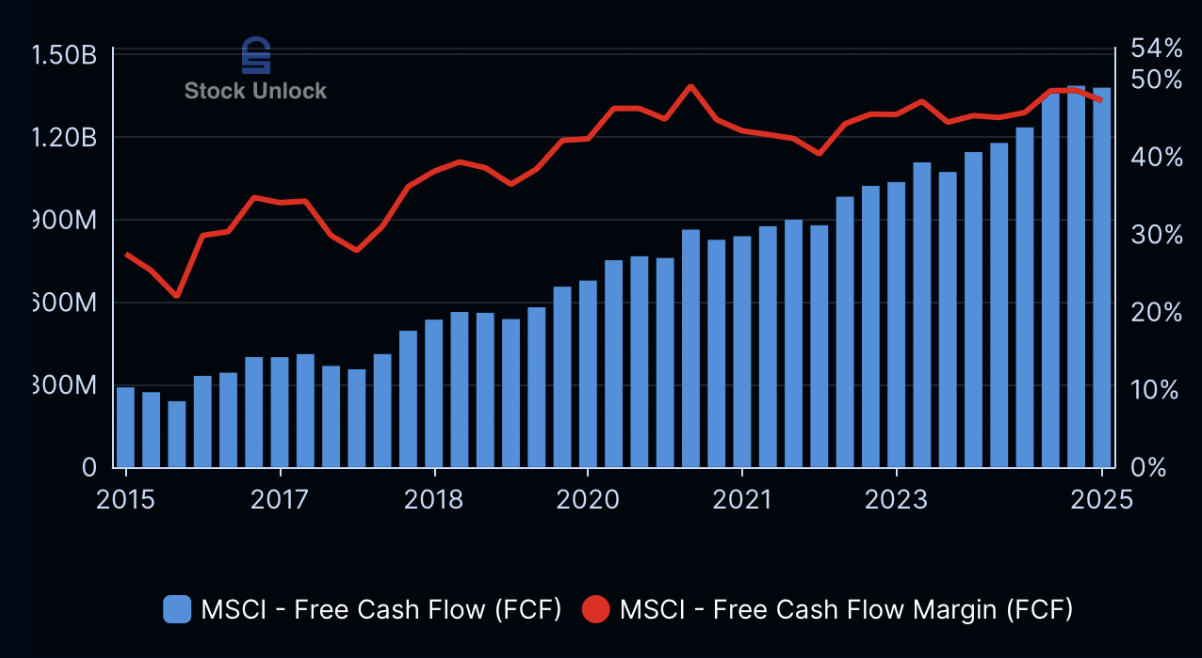
Recurring Revenue Type: Subscription (Index + ESG data)
Revenue Growth (10-year CAGR): 11.0% Free Cash Flow Growth (10-year CAGR): 15.9% Forward P/E multiple: 29.5x MSCI’s index segment is among the highest quality segments in the world with 96% retention rates and >70% EBITDA margins. As with S&P Global, this segment is also a winner from the rise of passive investing (through higher AUMs). In addition, MSCI’s other segments (Climate, ESG and Analytics data) also earn subscription-based revenue. This capital-light model makes MSCI a high-margin (47% free cash flow margins) cash cow with pricing power and switching costs. However, the stock has vastly underperformed the markets over the past 5 years. For investors who bought MSCI stock 4 years ago, their returns have been negative. Much of the underperformance can be tied to the fact that the stock was trading at 76x earnings at the 2021 peak. As the business has continued to grow and the stock has gone nowhere, the earnings multiple has also compressed significantly. Now, at less than 30x forward earnings and with double-digit growth most years, the stock looks a whole lot more reasonable. |
First, many of these companies are expensive on an earnings multiple basis. That is usually a sign that the market appreciates the business model and the predictability that comes with high levels of recurring revenue. It also means, however, that the stocks might not be good investments at current prices. Regardless, investors should study and understand recurring revenue businesses. In most cases, it is a sign of a competitively advantaged company creating value for customers. At the right prices, these are the businesses that can compound for decades. |
|
|
This Newsletter's Author
This newsletter was written by Jørgen Pettersen. You can find him on Twitter/X. |
|
|
Stock Unlock's newsletter is not a recommendation to buy or sell stocks. Stock Unlock does not provide financial advice, and we are writing this newsletter to help share ideas and teach you more about stock analysis. Please do not buy or sell stocks we discuss without doing your own research and/or consulting with a professional. |
|
|
In addition to providing education around investing fundamentals we are exploring adding value through sending our members stock ideas and analysis. Please let us know if you enjoy this type of newsletter or have any feedback. Let us know what you think by emailing support@stockunlock.com |
|
|
Join 4,000+ Investors on Discord |
| |
|
Connect with us on LinkedIn |
| |
|
|