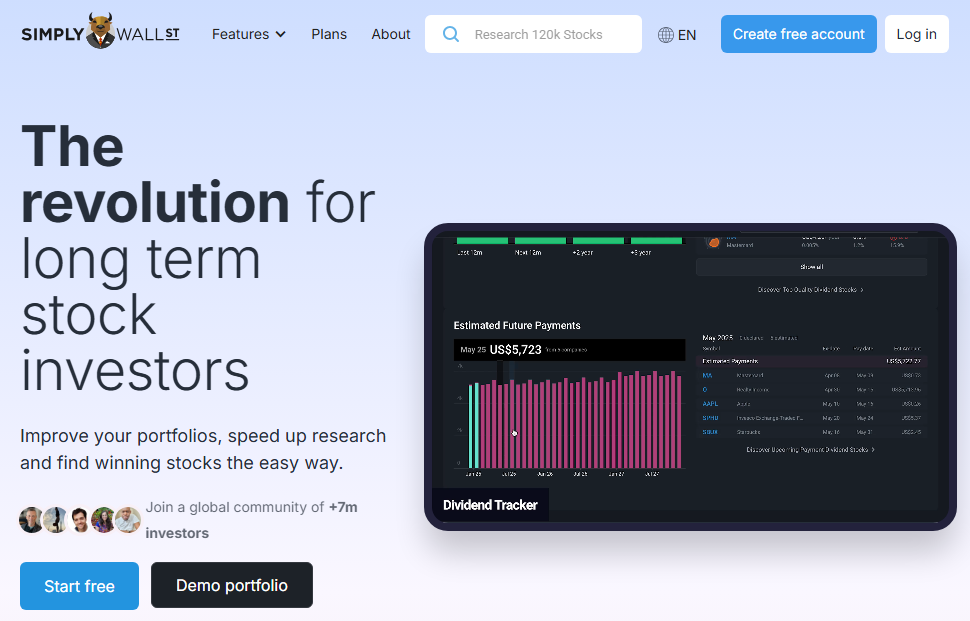
Simply Wall St has become one of the most recognizable names in retail investor tools, known primarily for its distinctive Snowflake visualization that summarizes a stock's fundamentals at a glance. As one of the most widely-used retail investing platforms, it has built its reputation on making complex financial data visually accessible to everyday investors.
This Simply Wall St review offers an extensive analysis of the platform. It may be the ideal choice for investors who:
- Prefer simple visual summaries over detailed company breakdowns
- Want a quick overview of a company's fundamental profile
- Are new to investing and find traditional financial data intimidating
- Value established platforms with large user communities
- Primarily analyze stocks rather than actively learn investing concepts
However, Simply Wall St might not be the best choice for those who:
- Want to learn investing concepts while analyzing stocks
- Need deep historical data spanning multiple decades
- Want industry-specific scoring rather than generalized algorithms
- Are looking for a complete investing toolkit in one platform
In this case, investors should consider Stock Unlock: a complete investment analysis platform built by investors who were frustrated with expensive, inadequate tools. Co-founded by Daniel Pronk (who runs an investing YouTube channel with over 264,000 subscribers) and Jake Ruth (a software engineer with over a decade of experience), Stock Unlock emerged from genuine frustration with an industry that charges too much for tools that don't deliver.
Unlike single-purpose apps, Stock Unlock provides the complete playbook: portfolio tracking with brokerage sync, proprietary stock scores that are industry-specific (not generic algorithms), a powerful stock search engine, dividend analysis, valuation tools, plus Learn Mode with education embedded directly into the investing workflow. With up to 35 years of historical data and pricing starting at $7.50/month (billed annually), it serves investors who want depth, education, and value without paying $50+ monthly for fragmented tools.
This review includes a detailed look at Stock Unlock later as the alternative for investors who want a complete toolkit that teaches while they invest. Those ready to explore a platform that grows with them from their first day of investing to their 40th year can start with Stock Unlock's free plan here.
Table of contents:
What is Simply Wall St?
Simply Wall St is a cloud-based stock analysis platform founded in 2014 in Sydney, Australia by Al Bentley and Nick Van Den Berg.
Bentley, an engineer by training, created the platform after experiencing frustration with existing investment tools that were overly complex and designed for financial professionals rather than everyday investors.
The platform's defining characteristic is its visual approach to fundamental analysis. Rather than presenting investors with spreadsheets and financial statements, Simply Wall St transforms company data into infographics and visual reports.
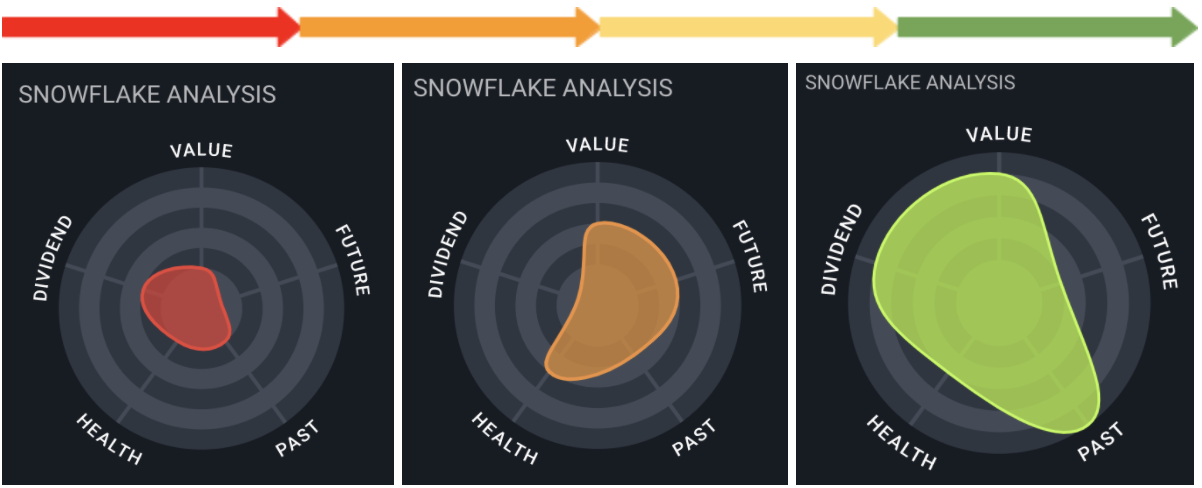
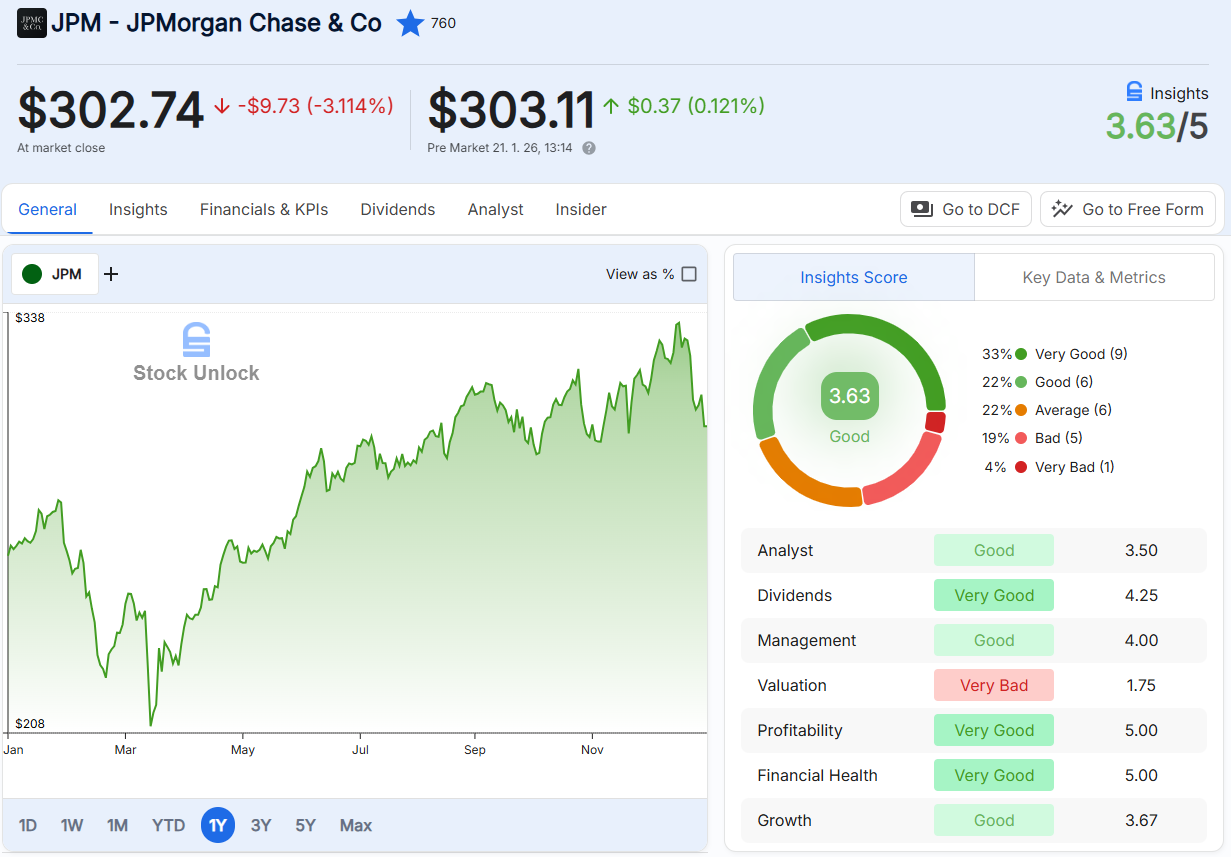
The centerpiece is the "Snowflake" diagram, a proprietary graphic that summarizes a stock's profile across five dimensions: value, future growth, past performance, financial health, and dividends.
Simply Wall St sources its financial data from S&P Global Market Intelligence and provides analysis on tens of thousands of stocks across global markets. The platform offers company reports, portfolio tracking, stock screening, and curated investment ideas.
Simply Wall St is well-suited for retail investors who prefer visual information and want a quick way to assess a company's fundamentals without diving into raw financial statements. The platform particularly appeals to beginners who find traditional financial analysis intimidating, as well as visual learners who grasp concepts better through graphics than numbers.
Simply Wall St Pros & Cons
| Pros | Cons | ||
|---|---|---|---|
| ✅ | Distinctive Snowflake visualization provides instant overview | ❌ | Analysis may feel simplified for experienced investors |
| ✅ | User-friendly interface accessible to beginners | ❌ | Automated valuations based on standardized DCF models |
| ✅ | Comprehensive global market coverage | ❌ | End-of-day data only, not real-time |
| ✅ | Portfolio tracking with broker synchronization | ❌ | Free plan limited to 5 company reports per month |
| ✅ | Established platform with 7 million+ users | ❌ | Annual billing is primarily promoted for paid plans |
| ✅ | Well-known in retail investor space | ❌ | Educational content separate from analysis workflow |
| ❌ | Auto-renewal practices can frustrate users | ||
Simply Wall St Review: How it Works & Key Features
The Snowflake Analysis: Visual Summary at a Glance
The Snowflake is Simply Wall St's signature feature.
This five-axis diagram provides an immediate visual summary of a company's fundamental profile. Each axis represents a key investment criterion: Value, Future Growth, Past Performance, Financial Health, and Dividends.
Each axis is scored out of several points, with points awarded based on automated checks performed on the company's financial data. The visual shape and color of the Snowflake indicate where a company excels and where it may have weaknesses. A larger, greener Snowflake generally indicates a company that has passed more fundamental checks, while a smaller, redder Snowflake suggests fewer successful checks.
Source: Simply Wall St
The Snowflake serves primarily as a quick screening tool. It allows investors to instantly identify the characteristics of a stock and determine if it aligns with their investment style. A company with high scores in Dividends and Value might appeal to income investors, while one scoring high in Future Growth might attract growth-focused investors.
Company Reports: Detailed Fundamental Breakdown
Simply Wall St's Company Reports expand on the Snowflake with detailed analysis across each of the five dimensions. The reports include:
Valuation Analysis: The platform uses Discounted Cash Flow (DCF) models to estimate intrinsic value, comparing the calculated fair value to the current share price. It also provides relative valuation through ratios like P/E, P/B, and P/S compared to industry averages and analyst price targets.
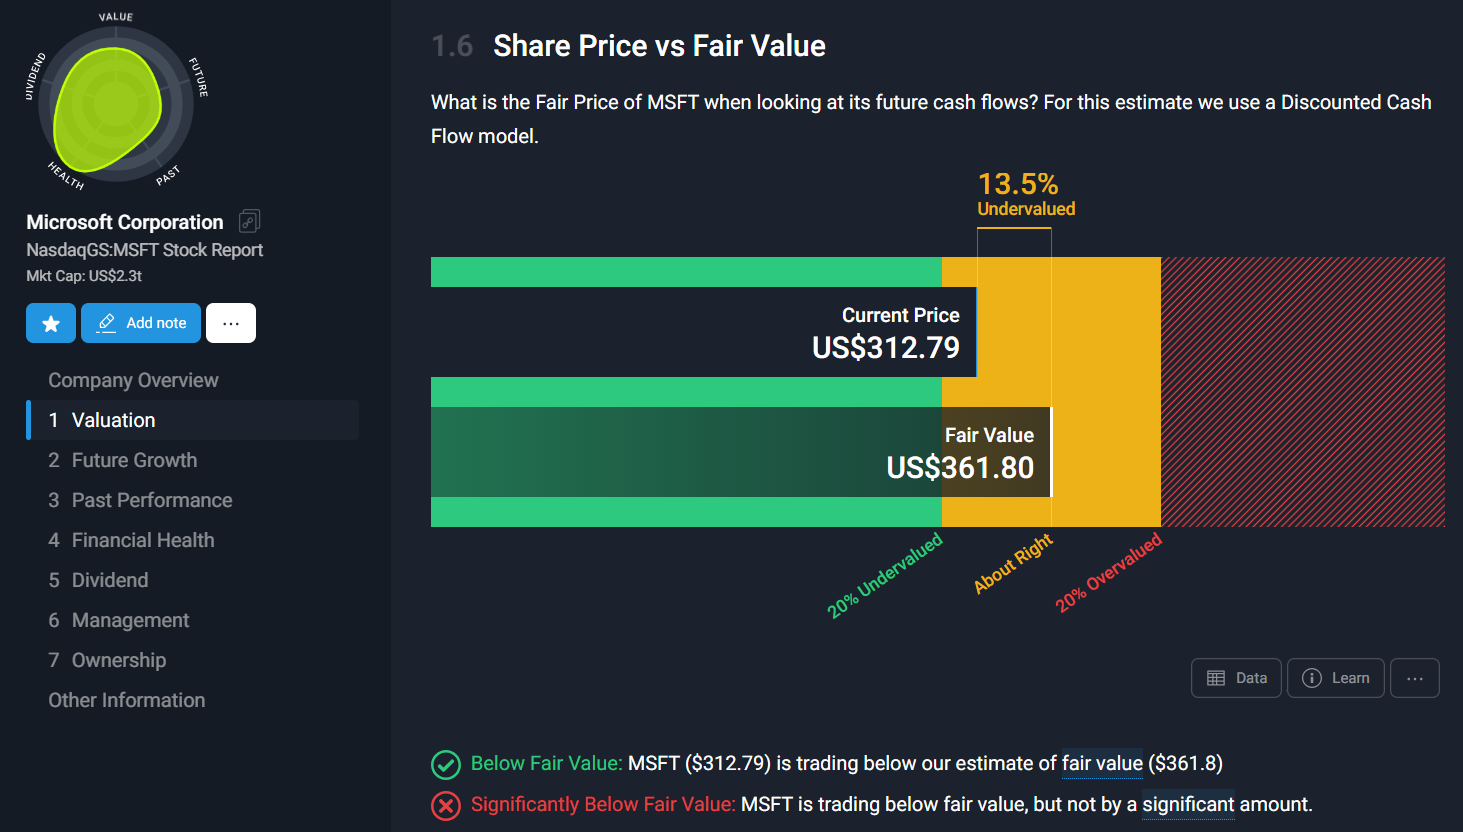
Source: Simply Wall St
Growth Forecasts: Revenue and earnings projections aggregated from professional analysts, displayed as charts showing expected annual growth rates over one to three years, compared against industry and market averages.
Past Performance: Historical trends in revenue, earnings, and profit margins, along with profitability ratios like Return on Equity and Return on Assets compared to industry benchmarks.
Financial Health: Balance sheet analysis including debt-to-equity ratios, short-term and long-term solvency checks, and visual representation of assets versus liabilities.
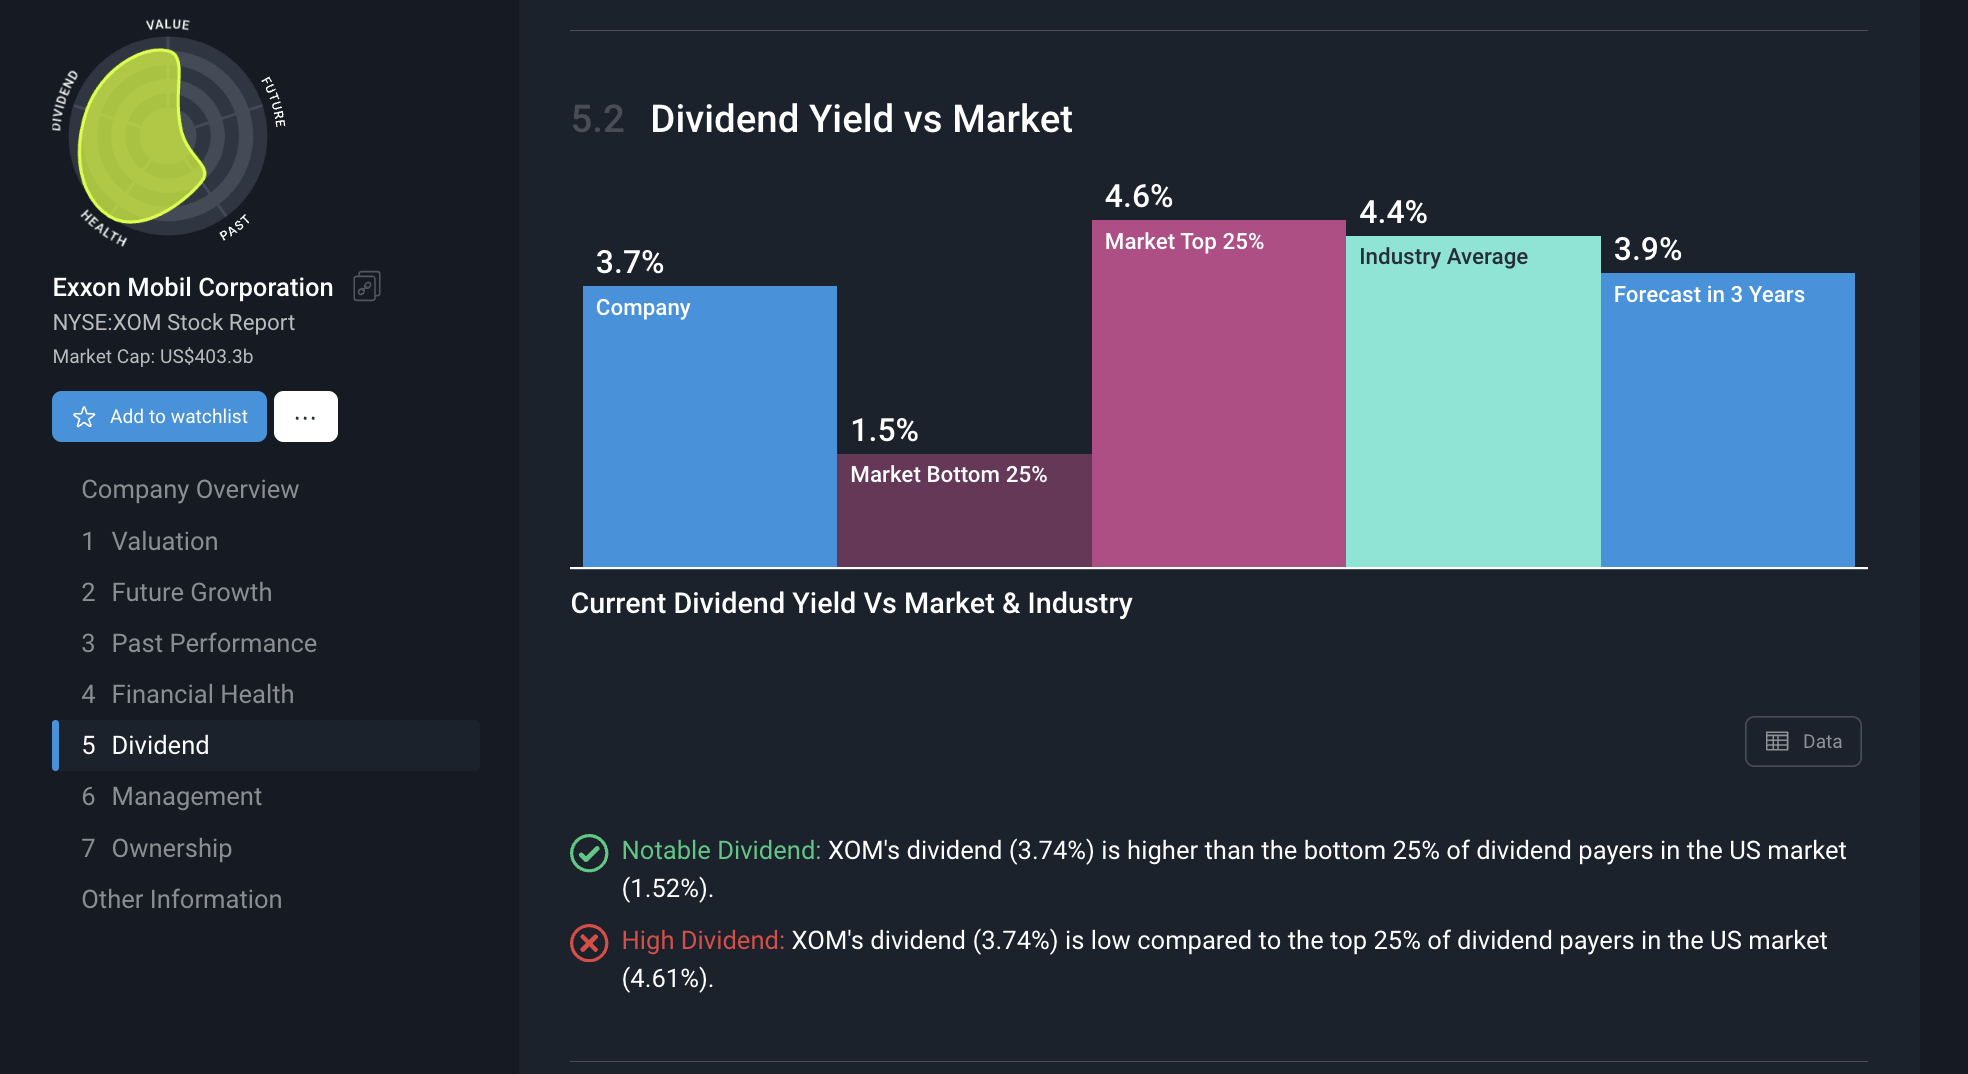
Dividend Analysis: For dividend-paying stocks, the report shows dividend yield, payout ratio, payment history, and dividend sustainability assessment.
Source: Simply Wall St
Each report also includes management and ownership information, showing executive compensation, board details, ownership breakdown by shareholder type, and recent insider transactions.
Portfolio Tracker: Consolidating Your Investments
The Portfolio Tracker allows users to monitor their holdings in one place. Simply Wall St supports two methods for populating portfolios:
Broker Synchronization: Users can securely connect brokerage accounts through third-party services like Plaid. The platform supports connections with over 2,000 brokers worldwide. Once linked, portfolios sync daily to reflect current holdings.
Manual Entry: For those preferring not to link accounts, holdings can be added manually with ticker symbols, share counts, and average purchase prices.
The tracker provides a Portfolio Snowflake showing the weighted average fundamental profile of all holdings. It calculates returns including unrealized gains, realized gains, dividends, and currency impact. Diversification visualizations show allocation by sector, industry, and geographic revenue exposure. The dividend section forecasts expected income for the coming year.
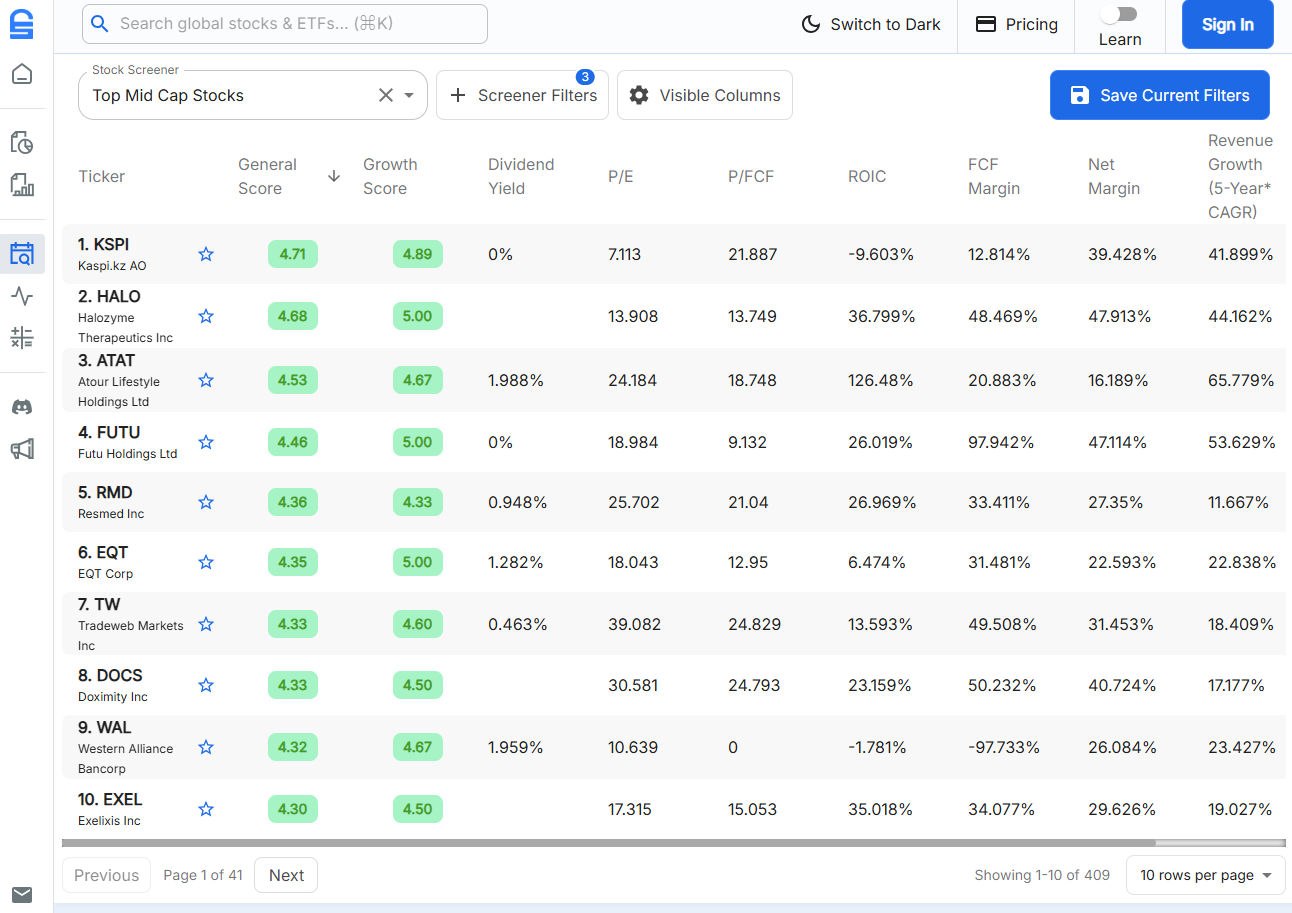
Stock Screener and Discovery Tools
Simply Wall St's Stock Screener incorporates Snowflake as a key filtering option.
Users can adjust Snowflake score thresholds, instantly filtering for companies that match their desired profile. Additional filters include country, sector, industry, and various fundamental metrics like P/E ratio, dividend yield, and market capitalization.
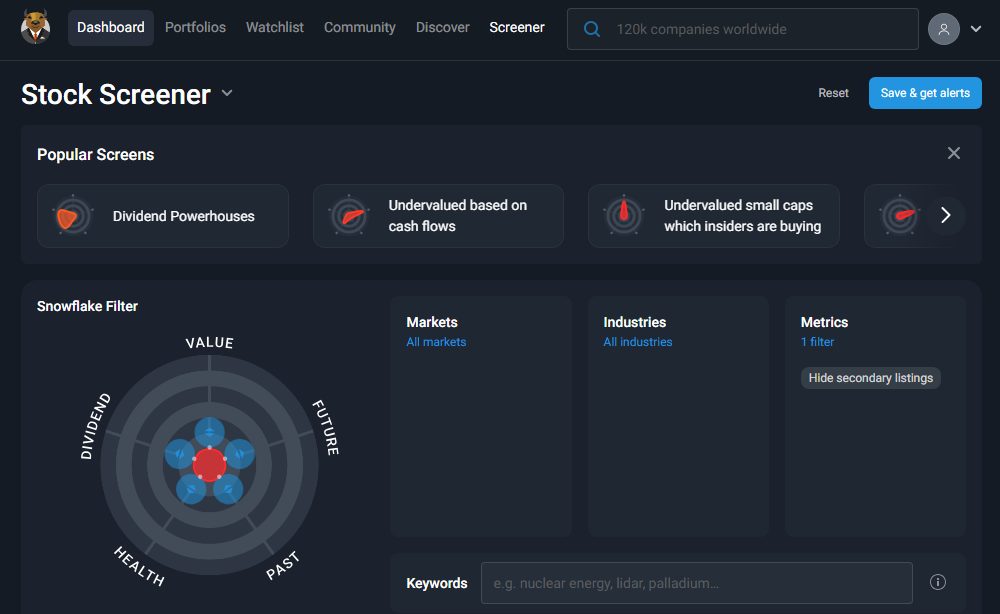
The platform offers pre-built "Investing Ideas" organized by theme (such as AI stocks, renewable energy, or dividend powerhouses) and by strategy (such as undervalued companies or high-growth stocks). These curated lists serve as starting points for investors who may not know where to begin their search.
Watchlists allow users to track companies they're interested in but don't yet own. Users can set their own fair value estimates for watchlisted stocks and track the share price against this valuation. The platform sends updates when significant events affect tracked companies.
Where Simply Wall St Falls Short
While Simply Wall St excels at making fundamental analysis visually accessible, several limitations become apparent with regular use. These limitations reflect a platform optimized for quick visual assessment rather than deep analytical work.
Visual Simplicity at the Cost of Depth: The Snowflake and automated reports, while useful for quick overviews, can feel simplified for investors wanting to dig deeper.
The platform's analysis is primarily designed to give investors an instant impression, not to support detailed due diligence. Experienced investors often find themselves needing to supplement Simply Wall St with additional investing tools.
Generic Scoring Algorithms: Simply Wall St's scores apply the same algorithmic template across all stocks regardless of industry. Additionally, their analysis model has not been updated in over four years, meaning it may not reflect current market conditions or evolving industry standards.
This matters because what makes a healthy technology company looks very different from what makes a healthy utility or bank. An industry-agnostic approach can produce misleading comparisons; the metrics that signal strength in one sector may be irrelevant or even concerning in another.
DCF Tools That Are Hard to Use Effectively: While the platform provides fair value calculations using automated DCF models, these apply standardized assumptions without meaningful user input.
For investors who want to model different scenarios or adjust projections based on their own analysis, the valuation tools offer limited flexibility. The valuations are prominently displayed and may be taken at face value by less experienced investors.
Educational Content Separated from Workflow: While Simply Wall St provides learning resources through a separate learning hub, this educational content exists separately from the investing experience. Users learn investing concepts in one place and analyze stocks in another, rather than learning in context as they invest.
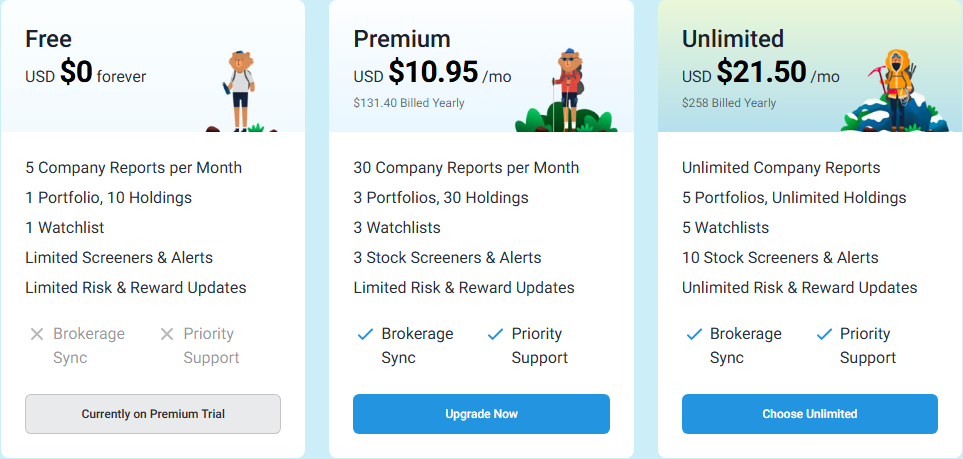
Pricing and Billing Practices: The free plan is quite restricted, limiting users to just 5 company reports per month and 10 portfolio holdings.
For meaningful use, a paid subscription is necessary. Simply Wall St primarily promotes annual billing for paid plans, which creates a significant upfront commitment for new users. Some users have also reported frustration with auto-renewal practices and unclear cancellation options.
Source: Simply Wall St
These limitations aren't failures but rather the natural result of optimizing for visual accessibility and quick assessment. However, they create a clear opportunity for platforms offering industry-calibrated analysis, decades of historical data, global coverage beyond US markets, and context that helps investors understand why the numbers matter.
Top Simply Wall St Alternative: Stock Unlock
Stock Unlock takes a fundamentally different approach, built by investors who were frustrated with paying too much for tools that didn't work.
The platform was founded in 2021 by Daniel Pronk and Jake Ruth (backed by Y Combinator). Pronk, who runs a YouTube channel with over 264,000 subscribers (as of January 2026) focused on value based fundamental investing, was using multiple expensive tools and maintaining time-consuming spreadsheets.
Back in 2020, Jake Ruth, a software engineer watching Daniel's videos as an investor himself, grew frustrated seeing smart creators spending money on poor-quality tools with misleading scores. He built a program to automate Daniel's spreadsheet work, then persistently reached out until they connected.
The platform emerged from genuine frustration with an industry that charges too much for inadequate tools.
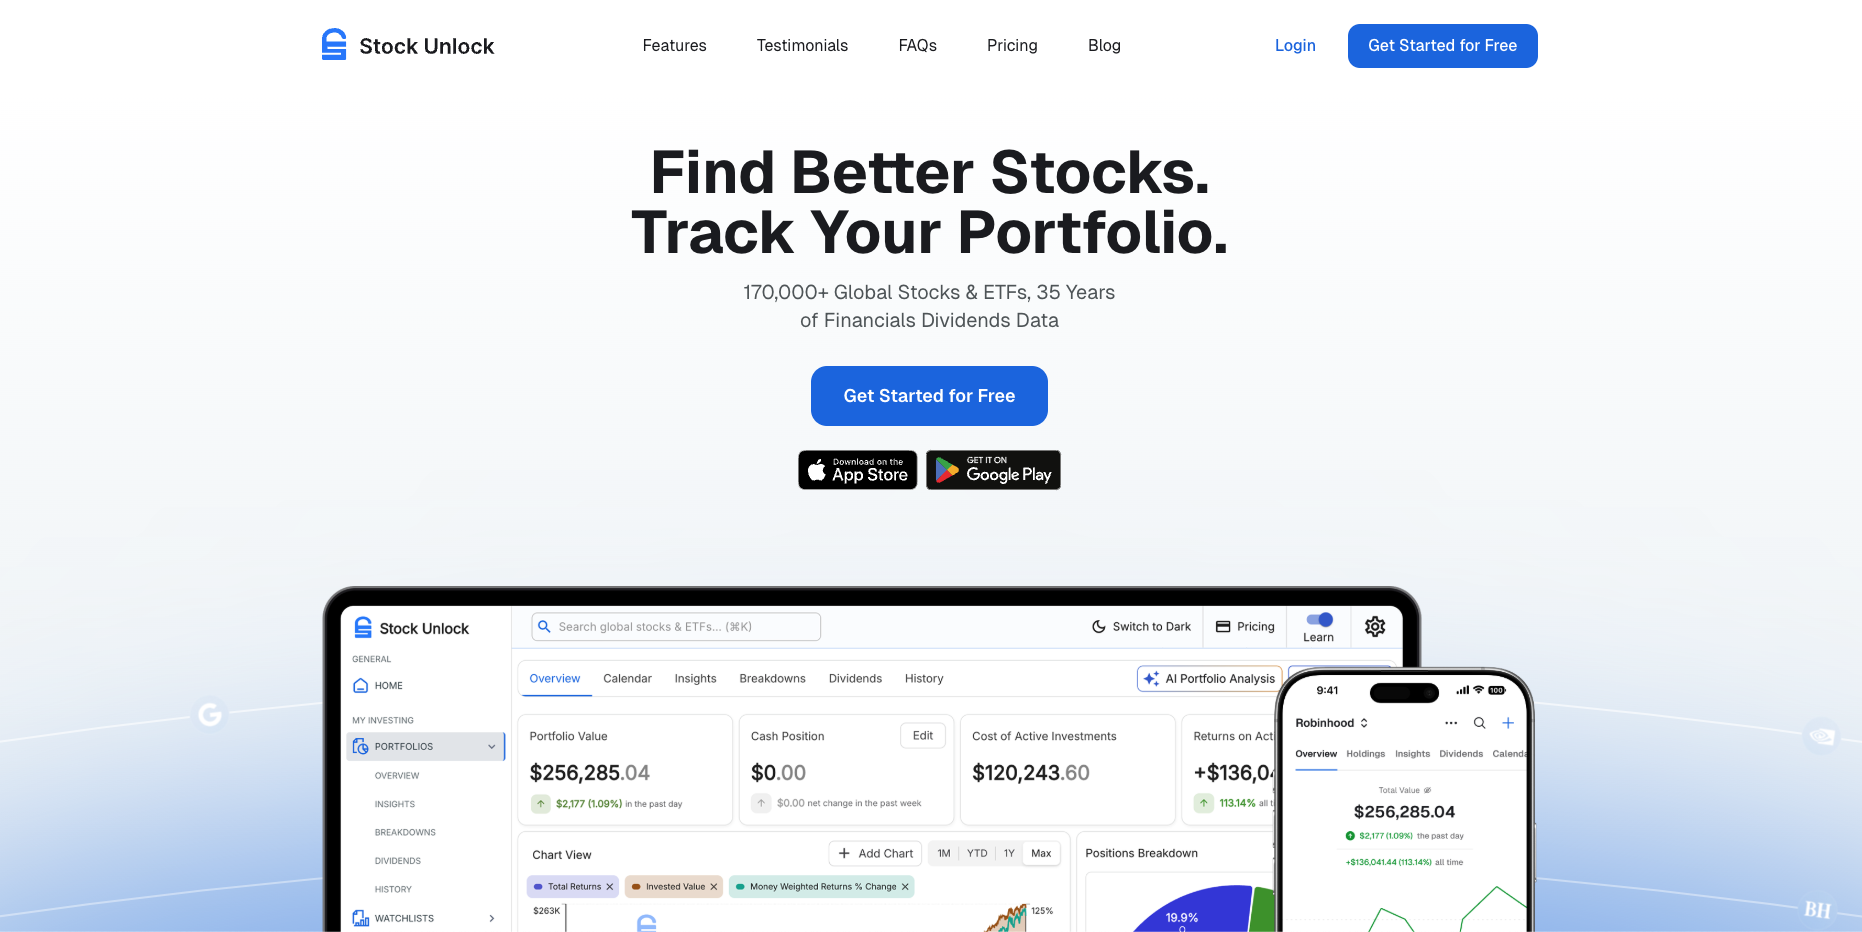
Stock Unlock's philosophy is straightforward: most of your money should go into investing, not into $50/month software subscriptions. It's designed to be a complete investing toolkit rather than a single-purpose app, taking users from their first day of investing through their 40th year with everything they need in one place.
Why Investors Switch from Simply Wall St
The difference becomes clear when looking at what users say. As one Product Hunt reviewer shared: "I stopped my subscription of Simply Wall Street because I didn't need it anymore. Now I don't know what I would do without Stock Unlock."
That sentiment reflects Stock Unlock's core advantage: it consolidates what previously required multiple subscriptions and messy spreadsheets into one cohesive platform.
Experienced investors find relief in no longer juggling tools. Newer investors appreciate a non-predatory environment where they can learn without payment pressure, using "training wheels" that grow with them.
Stock Scores: Industry-Specific Analysis That Works
Stock Unlock's Stock Scores evaluate companies across seven dimensions: Analyst, Valuation, Growth, Profitability, Dividends, Financial Health, and Management.
What distinguishes this system is that the algorithms are specifically calibrated for different industries, not applied uniformly across all companies the way Simply Wall St's Snowflake works. Stock Unlock's scoring algorithms are also constantly updated and refined as more data becomes available, as industries evolve, and as companies mature.
This matters because the metrics that define a healthy company vary significantly by sector. A high-growth technology company might reasonably trade at valuation multiples that would be concerning for a utility company. A bank's financial health relies on different indicators than a manufacturer's.
By tailoring scores to industry context, and for companies with truly unique financials, calibrating at the individual stock level, Stock Unlock provides assessments that actually reflect reality. This granularity comes from years of building software engineered specifically for these edge cases.
The platform covers over 170,000 stocks and ETFs across 70+ global exchanges. Each score includes a breakdown showing the individual factors that contributed to the rating.
Learn Mode: Education Built In
For investors just starting out, Learn Mode acts as a built-in guide throughout the Stock Unlock experience, explaining concepts in context as you encounter them. Indicator icons appear next to financial metrics throughout the platform, and clicking any of them reveals an explanation of what the metric means, how it's calculated, and how investors typically use it.
Experienced investors can toggle Learn Mode off to remove the icons from the interface entirely.
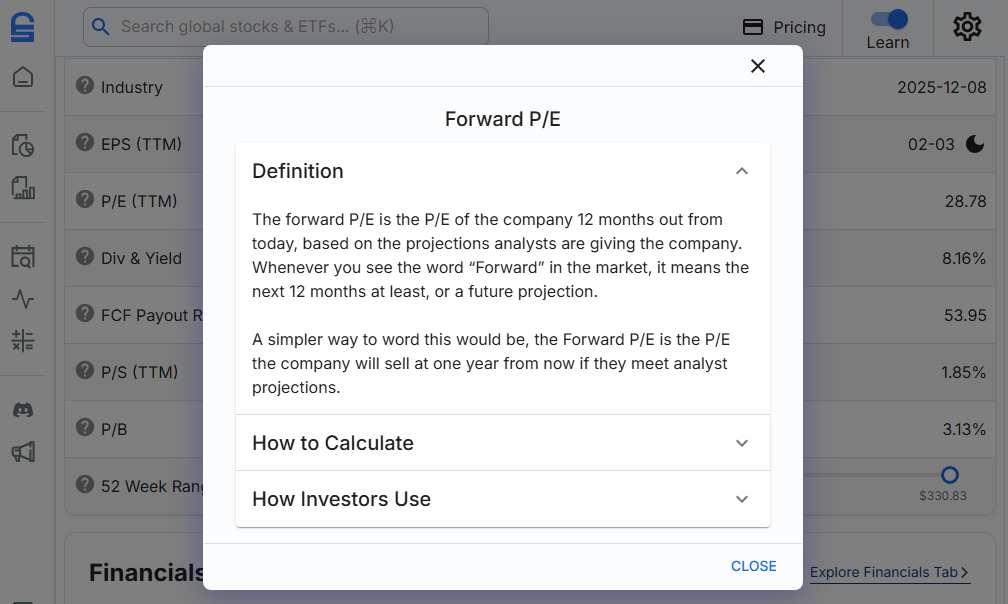
This addresses a problem Simply Wall St doesn't solve: the disconnect between learning investing concepts and actually applying them. Instead of reading about P/E ratios in a separate learning hub and then trying to remember what was learned when encountering one, investors learn in context as they analyze real companies.
The education system has traditionally kept this knowledge reserved for wealthy asset holders. Stock Unlock opens that door, walking users through complex financial concepts without requiring another degree.
Learn Mode can be toggled off by experienced investors who don't need the explanations. For those building their investing knowledge, it helps decode sometimes complex financial jargon.
Portfolio Tracker: Built for Long-Term Investors
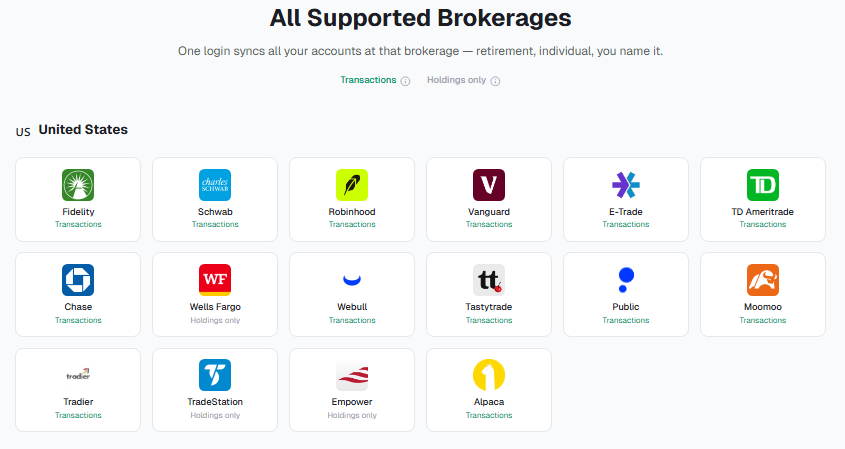
Stock Unlock's Portfolio Tracker goes well beyond basic position tracking. It supports brokerage synchronization through SnapTrade, connecting with all major brokerages including Fidelity, Schwab, Robinhood, Interactive Brokers, and many more.
Source: Stock Unlock
Unlike many competitors, Stock Unlock offers a 15-day free brokerage connection for all free accounts, no credit card required. This allows investors to test everything and see automatic portfolio updates before committing.
The portfolio tracker goes beyond basic P&L, showing time-weighted returns, dividend impact, and position-level performance so you can see what's actually driving your results.
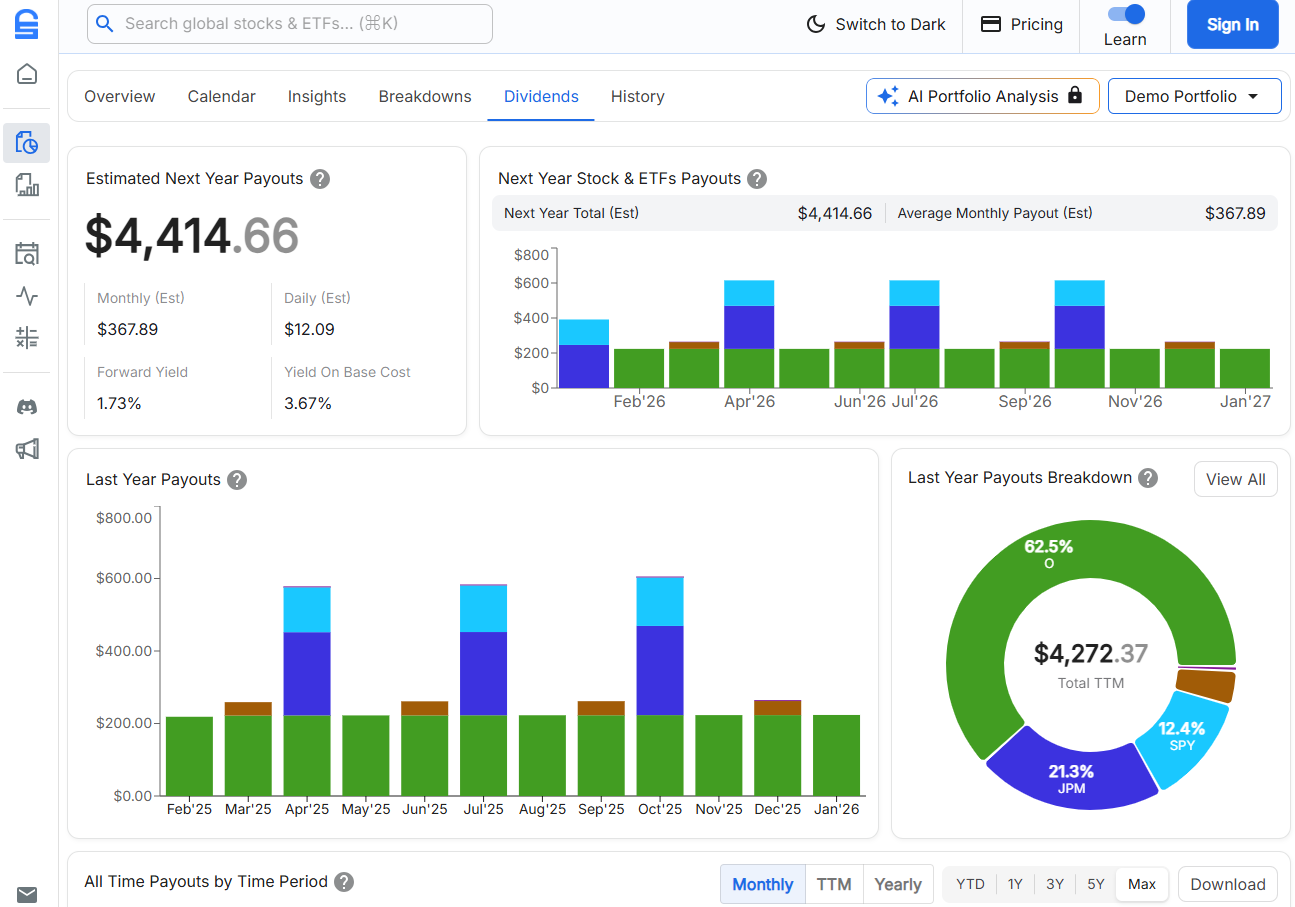
Investors will find a Portfolio Health Score derived from Stock Unlock's proprietary stock scores, AI-powered portfolio analysis (and an "AI portfolio roast" for when a reality check is needed, or a good laugh), income tracking scenarios, and a portfolio calendar that tracks all past and future events.
The dividend tracking is particularly comprehensive. Stock Unlock provides more ways to visualize and understand dividend income than most platforms: dividend history and forecasting, safety scores, yield analysis, and income projections. Try the dividend tools yourself to see the difference.
The platform is available on web, iOS, and Android, with mobile apps that sync seamlessly with the web account.
DCF Calculator: Professional-Grade, Accessible to Everyone
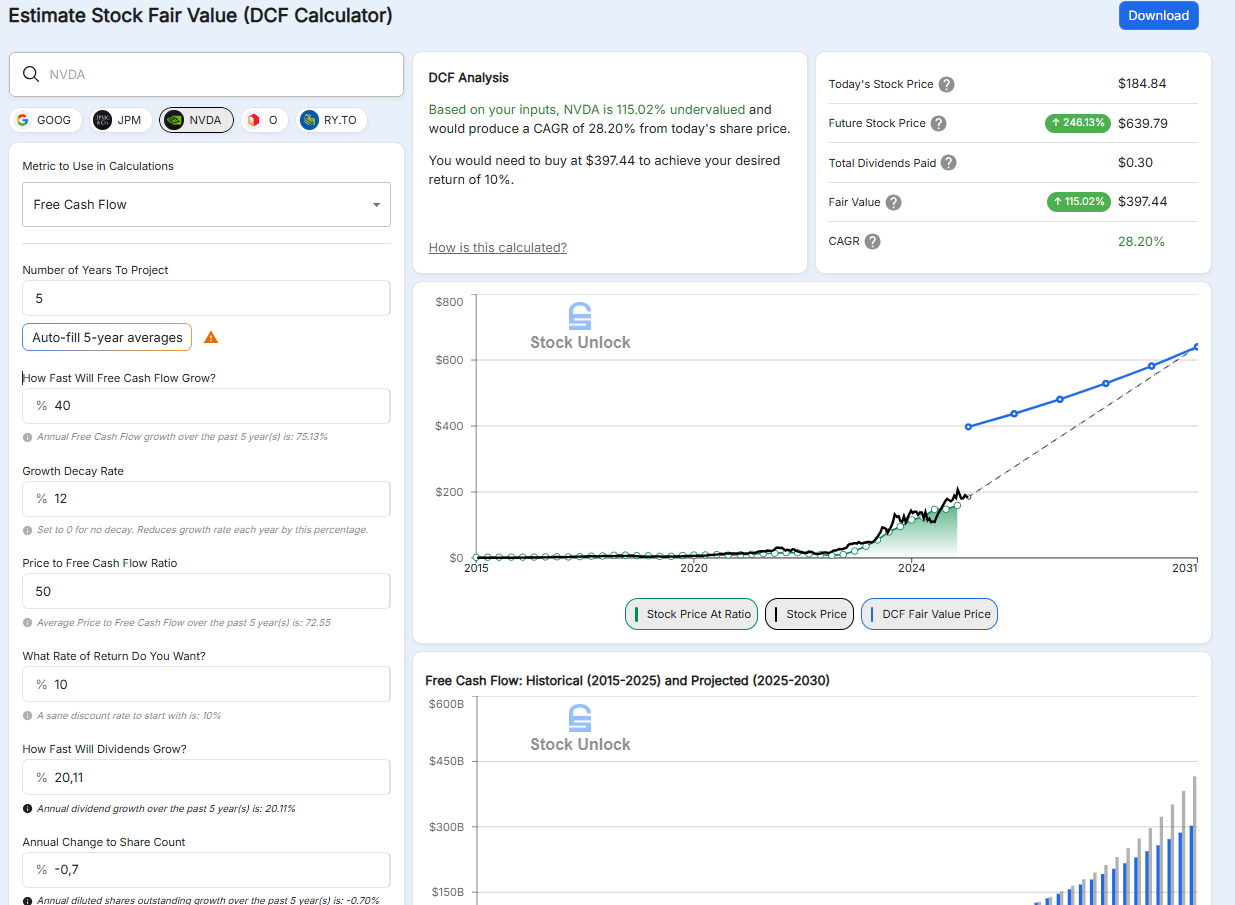
Stock Unlock's Future Stock Value Calculator (DCF) addresses a core limitation of Simply Wall St's automated valuations.
While Simply Wall St hardcodes assumptions, Stock Unlock projects across seven different metrics, where most competitors limit investors to one or two. Users can model dividend growth and diluted shares outstanding, and a growth decay feature prevents projections from ballooning unrealistically.
The calculator uses historical averages as starting points that can then be adjusted based on the investor's own fair value analysis. An educational overlay explains what each input means and how it affects the result, helping investors understand the valuation process rather than just accepting an automated output.
Powerful Stock Search Engine
Stock Unlock's stock search engine (also known as a stock screener) combines the proprietary Stock Scores with 85+ filters across fundamentals, valuation, dividends, and more.
Unlike Simply Wall St's Snowflake-based screener that applies generic criteria, Stock Unlock lets investors search using industry-specific scores to quickly find investments that fit their portfolio goals, or avoid ones that don't.
Presets and easy-click starter screens help new users dive in immediately, while paid users can save favorite searches for one-click re-application. Powerful enough for serious investors, accessible enough for beginners.
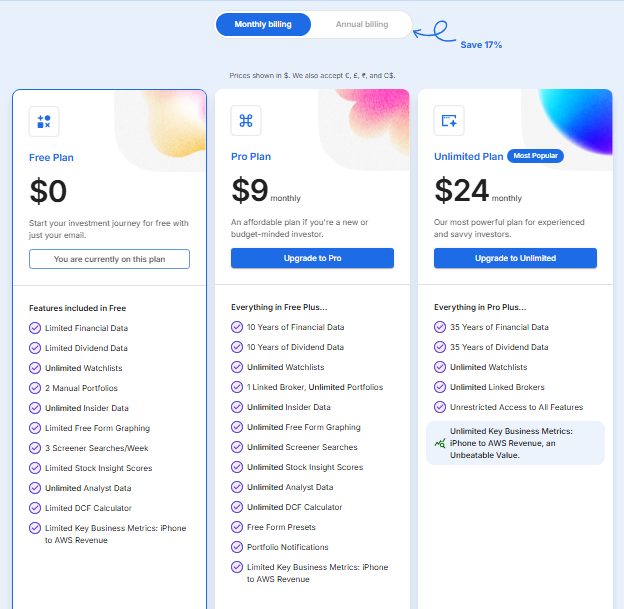
Pricing: More Value at a Better Price
Stock Unlock's pricing philosophy is simple: professional-grade tools shouldn't cost an arm and a leg.
The free tier is among the most generous in the industry: more value given away for free than most competitors. This includes access to Stock Scores, limited historical data, manual portfolios, the 15-day free brokerage connection, and a functional stock search engine.
Paid plans start at $7.50/month with annual billing, or $9/month if you prefer to pay monthly. The Unlimited tier is $20/month annual. All paid plans include a 30-day money-back guarantee for first-time customers.
Compare this to competitors charging $50/month for similar or worse features with no way to test the platform for free first.
Source: Stock Unlock
Simply Wall St or Stock Unlock: Comparison Summary
| Aspect | Simply Wall St | Stock Unlock |
|---|---|---|
| Primary Focus | Visual stock summaries | Complete investing toolkit with education |
| Signature Feature | Snowflake visualization | Learn Mode + Industry-Specific Scores |
| Scoring System | 5-axis Snowflake (uniform algorithm) | 7-category Stock Scores (industry-specific) |
| Historical Data | Standard historical depth | Up to 35 years |
| Educational Approach | Separate learning hub | Integrated into investing workflow |
| DCF Calculator | Automated, limited user input | Interactive with 7 metrics + growth decay |
| Portfolio Features | Basic tracking + Snowflake | Health Score, AI analysis, calendar, income tracking |
| Mobile Apps | Yes | Yes (iOS & Android) |
| Free Brokerage Connection | Not offered | 15 days free, no credit card |
| Free Plan | 5 reports/month, 10 holdings | Generous tier with stock search access |
| Entry Paid Plan | ~$10/month (annual only) | $7.50/month annual, $9/month monthly |
| Billing Options | Primarily annual | Monthly or annual |
| Money-Back Guarantee | Limited | 30 days |
| User Base | 7 million+ accounts | Growing community |
| Best For | Quick visual assessment | Investors who want to understand, not just see |
Final Verdict
The choice between Simply Wall St and Stock Unlock depends on what investors value most in their investment analysis process.
Choose Simply Wall St for an established platform known for its distinctive visual approach to stock analysis.
The Snowflake provides an instant, at-a-glance summary that makes it easy to quickly assess whether a company fits specific investment criteria. Investors comfortable with streamlined fundamental analysis who prefer visual summaries over detailed data will find that Simply Wall St delivers that experience with a polished interface and a large community of fellow users.
Get started with Simply Wall St here.
Choose Stock Unlock for a complete investing toolkit with context built in, not bolted on as a separate learning hub.
The integrated Learn Mode helps decode sometimes complex financial jargon, explaining concepts in context as they're encountered. Stock Unlock is built for investors who believe in fundamental, long-term investing and view stocks as buying businesses with cash flows, management, and competitors, not just numbers bouncing on a page.
For those who have been using multiple expensive tools or maintaining messy spreadsheets, Stock Unlock offers relief: one platform that does everything, at a price that lets most of the money go into actual investing. For newer investors, built-in guidance helps build confidence without feeling like a separate course.
Industry-calibrated scores, integrated guidance, and pricing that respects users are investors, not subscription revenue targets.
Try the live portfolio demo for free or start with Stock Unlock's free plan here.
Both platforms serve retail investors who want accessible fundamental analysis. Simply Wall St prioritizes visual simplicity and instant assessment. Stock Unlock prioritizes learning, analytical depth, and providing everything investors need in one place.
The choice depends on whether an investor wants a quick overview or a platform built for depth and long-term use.