GuruFocus has earned its reputation as one of the most comprehensive research platforms for value investors, serving over 20,000 premium members who want to analyze stocks the way legendary investors do. With decades of financial data, powerful screening tools, and detailed tracking of institutional portfolios, it offers serious investors a deep well of information to draw from.
This GuruFocus review analyzes the platform extensively. GuruFocus is the ideal choice if:
- You want to track the portfolios and trades of renowned institutional investors
- You need up to 30 years of historical financial data for in-depth analysis
- You value a powerful stock screener with hundreds of filtering options
- You're comfortable investing significant time to master a comprehensive platform
- You have the budget for a premium research tool ($499/year minimum)
However, GuruFocus might not be the best choice if:
- You want professional-grade analysis tools without maintaining multiple subscriptions
- You're an experienced investor looking to consolidate from expensive tools or complex spreadsheets
- You need an affordable platform with a generous free tier and monthly billing options
- You prefer a clean, intuitive interface that delivers depth without clutter
- You're a committed investor who wants to learn proper fundamental analysis while you research
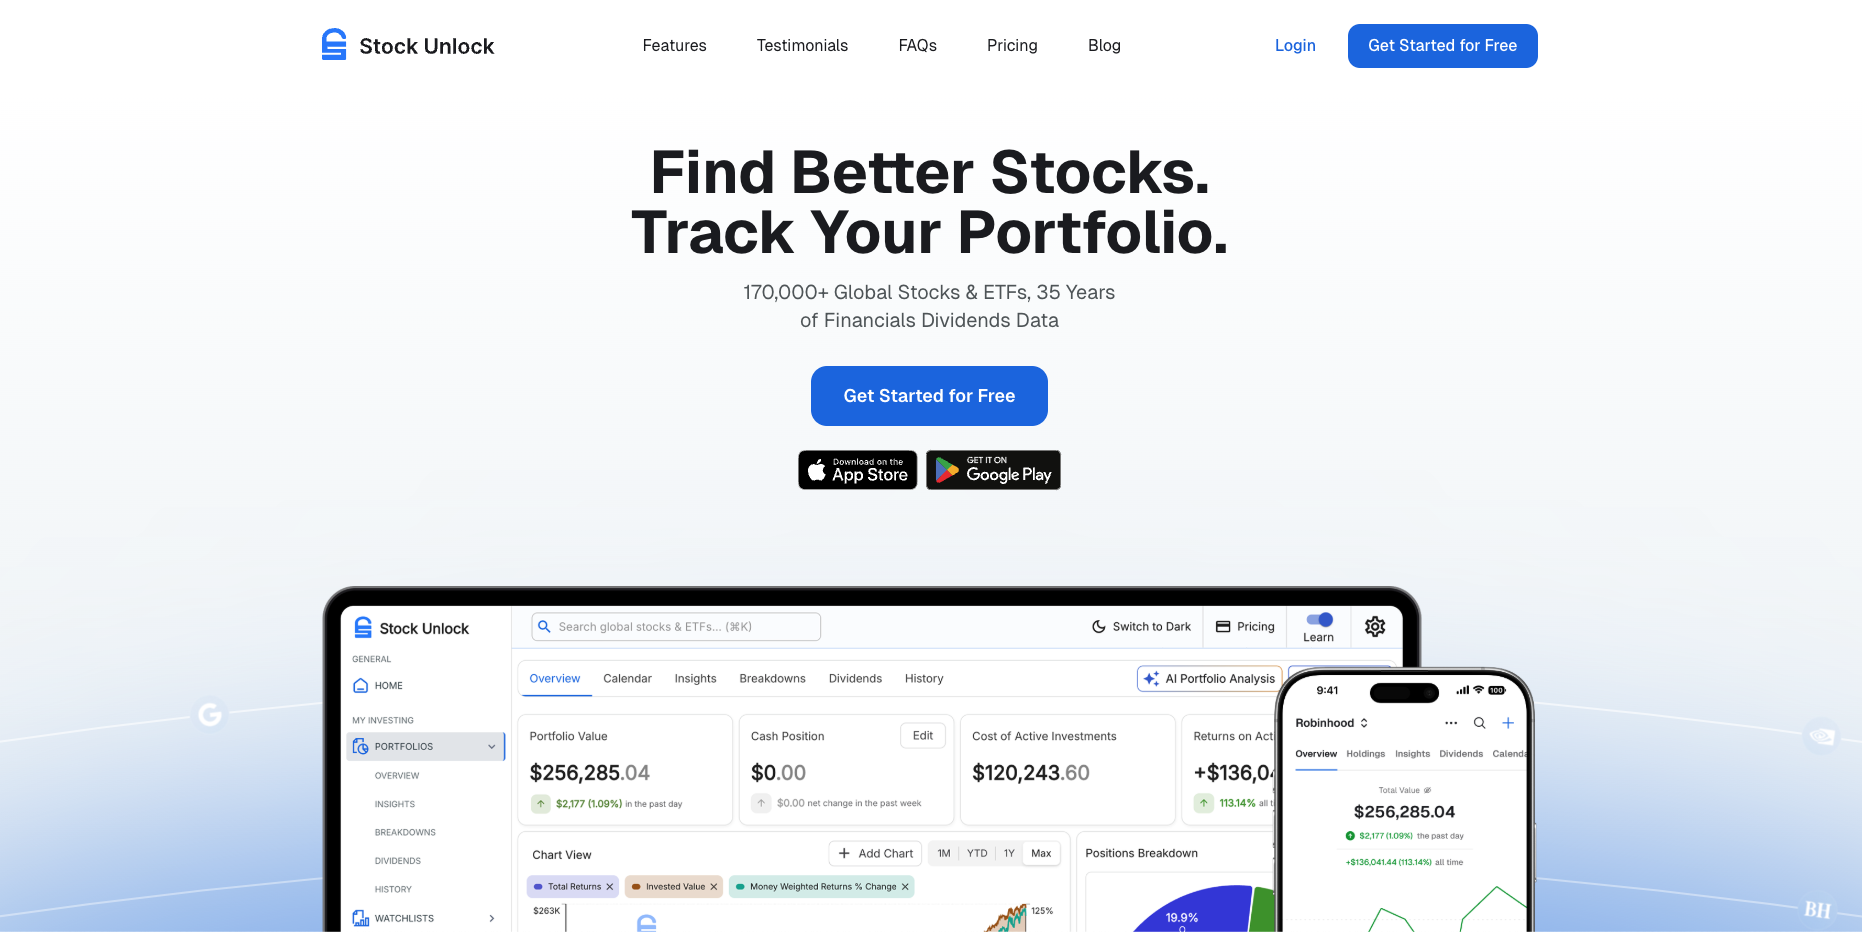
In these cases, you should consider Stock Unlock: an investment analysis platform built for long-term, fundamental-based investing. Backed by Y Combinator and trusted by investors in over 100 countries, Stock Unlock offers a complete investing toolkit—portfolio tracking, proprietary Stock Scores, dividend analysis, valuation tools, and embedded education, at a fraction of the cost of professional platforms.
Because of that, this review includes a detailed look at Stock Unlock later as an alternative for investors seeking both power and accessibility. To explore the platform, you can see Stock Unlock's features here, or jump straight into the app without creating an account.
Table of contents:
What is GuruFocus?
GuruFocus was founded in December 2004 by Dr. Charlie Tian, a physicist who experienced losses during the dot-com bubble burst in 2000. That experience led him to believe that studying the investment strategies of successful value investors like Warren Buffett and Peter Lynch could help individual investors avoid similar mistakes.
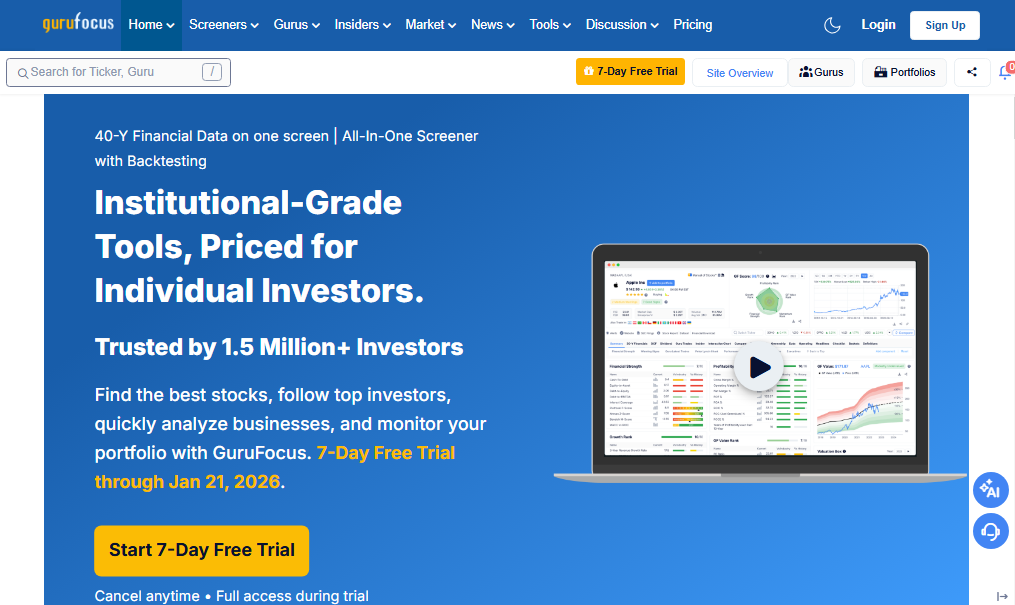
The platform started as a way to track and learn from the investment ideas of well-known investors through their public filings. Today, GuruFocus has evolved into a comprehensive value investing research platform covering over 100,000 stocks across approximately 100 global markets.
Key features include the "All-in-One Screener" with over 500 filters, up to 30 years of historical financial data, tracking of 8,000+ institutional investors, and proprietary valuation tools like the GF Score and GF Value. The platform also offers DCF calculators, interactive charts, and Excel/Google Sheets add-ins for custom analysis.
GuruFocus primarily serves financial advisors, professional analysts, and serious individual investors who are committed to fundamental, long-term value investing. The platform maintains an A+ rating from the Better Business Bureau and a strong rating on Trustpilot.
GuruFocus Pros & Cons
| Pros | Cons | ||
|---|---|---|---|
| ✅ | Up to 30 years of historical financial data | ❌ | Steep learning curve for new users |
| ✅ | Powerful All-in-One Screener with 500+ filters | ❌ | Limited free plan with restricted features |
| ✅ | Tracks portfolios of 8,000+ institutional investors | ❌ | Pricing starts at $499/year minimum |
| ✅ | Proprietary GF Score and GF Value metrics | ❌ | Annual billing only (no monthly option) |
| ✅ | Global market coverage (100+ countries) | ❌ | Interface feels dated and overwhelming |
| ✅ | Excel and Google Sheets add-ins for custom analysis | ❌ | Navigation can be confusing |
| ✅ | Dedicated customer support | ❌ | Charting tools less advanced than some competitors |
GuruFocus Review: How it Works & Key Features
All-in-One Screener: A Comprehensive Search Tool
The All-in-One Screener is one of GuruFocus's most powerful features.
It allows users to filter through over 90,000 stocks worldwide using more than 500 criteria. Filters are organized into tabs covering Fundamentals, Valuation Ratio, Profitability, Growth, Valuation Rank, Price, Dividends, Gurus, and Insiders.
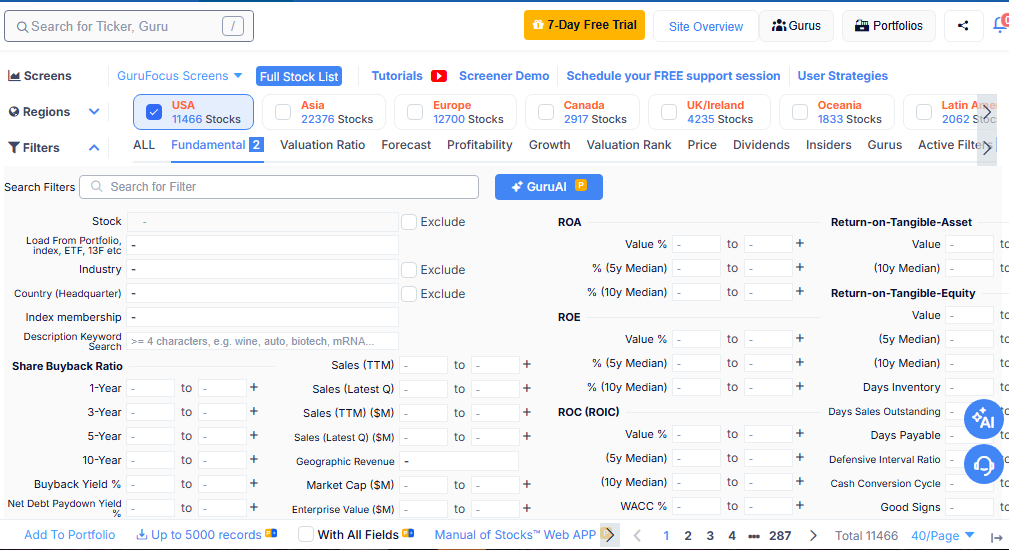
Users can screen for stocks based on traditional metrics like P/E ratio and revenue growth, but also by guru ownership and insider trading activity. For example, you can find stocks bought by multiple gurus in the last quarter or companies where the CEO has been buying shares.
GuruFocus provides pre-built screeners based on strategies from famous investors including Warren Buffett, Benjamin Graham, and Peter Lynch. Users can also create custom filters using their own formulas and save screening criteria for future use.
A backtesting feature lets Premium Plus members test their screening strategies using historical data back to 2006.
Guru and Insider Data: Tracking the Smart Money
A defining feature of GuruFocus is its extensive tracking of institutional investor portfolios. The platform monitors over 8,000 institutional investors and more than 15,000 mutual funds, pulling data from quarterly 13F filings with the SEC.
For each tracked "guru," users can view current holdings, trade history, and performance metrics. The platform shows new buys, additions, reductions, and sold-out positions. Users can create a personalized list of gurus to follow and build aggregated portfolios based on their combined holdings.
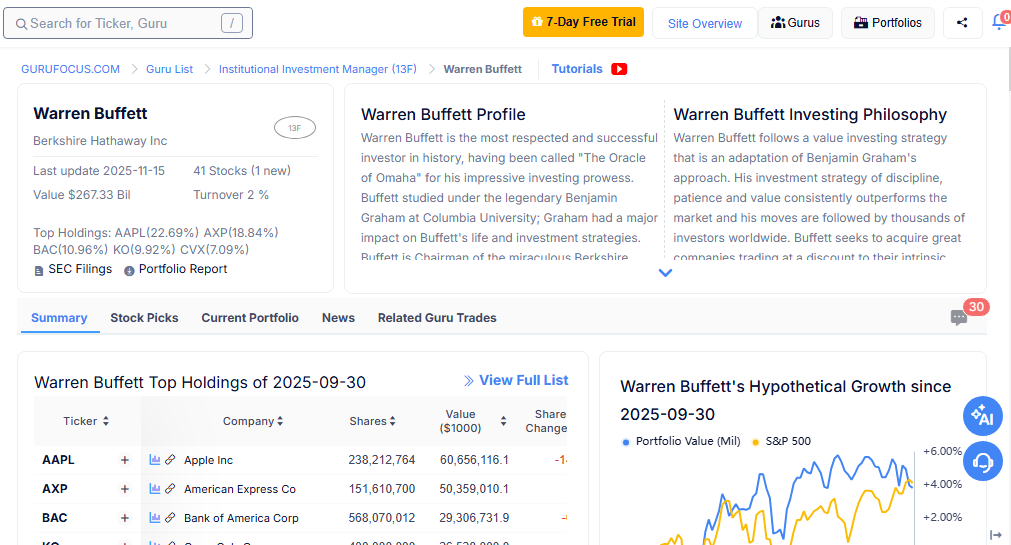
Insider trading data spans back to 2004 and updates daily based on SEC Form 4 filings. GuruFocus offers unique screeners like "Double Buy" (stocks bought by both gurus and insiders) and "Triple Buy" (guru buys, insider buys, and company buybacks). There's also a Politician Trading Tracker that monitors stock trades by members of Congress and the Senate.
Stock Summary & Financials: Deep Company Analysis
Each stock on GuruFocus has a comprehensive summary page displaying key metrics at a glance.
At the top, users see the GF Score (a 0-100 ranking based on profitability, growth, financial strength, momentum, and valuation) along with any Warning Signs or Good Signs that the system has flagged.
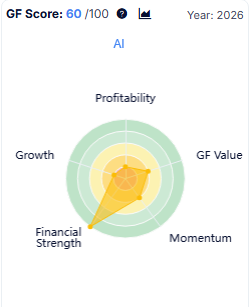
The GF Value chart compares the current stock price to GuruFocus's estimate of fair value, with green and red zones indicating potential undervaluation or overvaluation. The platform analyzes companies across multiple dimensions: Financial Strength, Profitability Rank, and Growth Rank, each with specific metrics and historical trends.
Financial statements are available for up to 30 years, including income statements, balance sheets, and cash flow statements.
Users can view data annually or quarterly, export to Excel, or access it through the API. A Warning Signs feature automatically checks 32 different metrics to flag potential issues like financial distress risk or possible earnings manipulation.
Valuation Tools: Multiple Approaches to Fair Value
GuruFocus provides several valuation tools centered on the principles of value investing.
The DCF Calculator uses a two-stage model where users can project earnings or free cash flow over custom time periods. The calculator pre-populates with default values based on historical performance but allows complete customization of growth rates, discount rates, and terminal values.
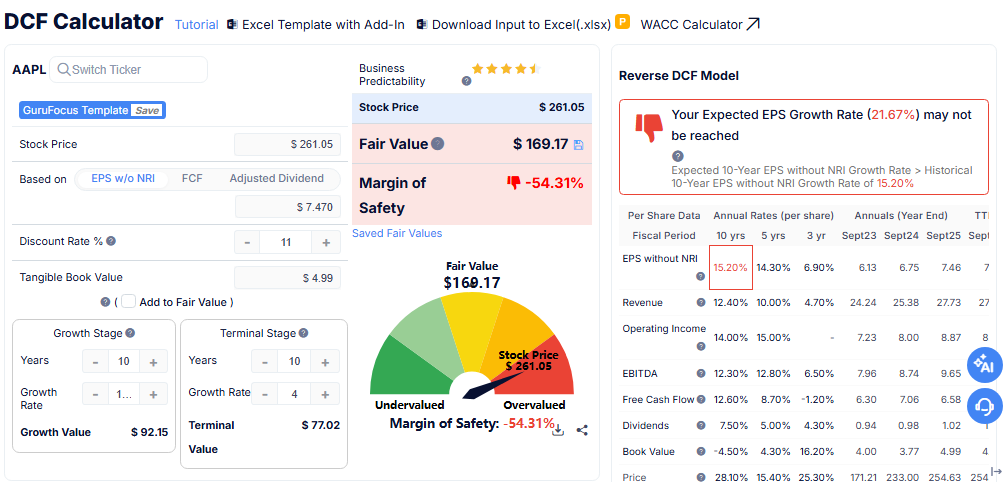
The GF Value is a proprietary metric that estimates intrinsic value based on historical trading multiples, past returns, and future growth estimates. A Reverse DCF Calculator takes the opposite approach: starting with the current stock price, it calculates what growth rate would be needed to justify that price.
The Peter Lynch Chart compares stock price to an earnings line representing a P/E of 15, providing a visual assessment of valuation over time. The platform's Interactive Charts feature lets users plot thousands of different data points and overlay economic indicators, complementing these valuation tools.
Where GuruFocus Falls Short
While GuruFocus offers impressive depth, several limitations reveal a platform optimized for professional-grade analysis rather than accessibility.
Overwhelming Feature Complexity: Users frequently describe the interface as cluttered and confusing, with multiple overlapping menus and an abundance of data that can be difficult to navigate.
What should be simple tasks often require familiarity with the platform's structure. As a platform that's been around since 2004, some of the interface design reflects the era in which it was built, creating a steep learning curve that can discourage newer investors.
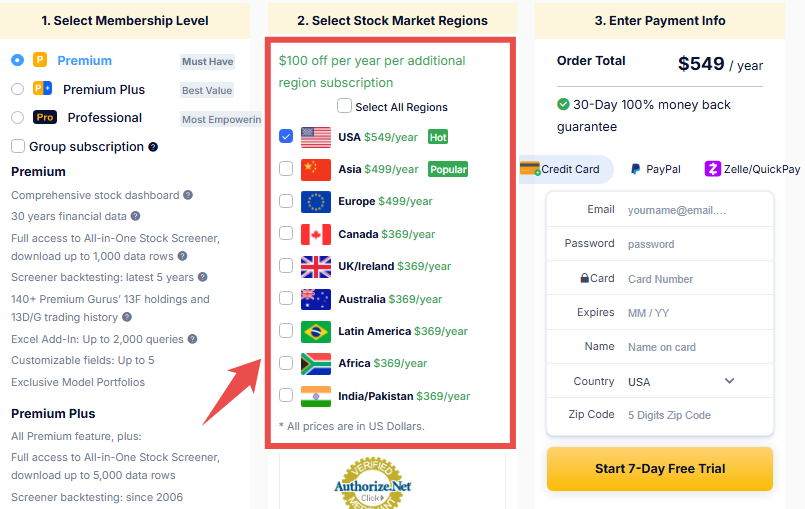
Cost Barriers for Individual Investors: With a limited free tier that restricts access to most premium features, and pricing starting at $499 per year for a single region, GuruFocus positions itself as a premium tool.
The Premium Plus tier at around $1,398/year unlocks full guru tracking and unlimited Excel queries. For retail investors with smaller portfolios, this cost may be difficult to justify, especially when they may not utilize the majority of available features.
Limited Educational Guidance: The platform provides extensive data and powerful tools, but assumes users already understand how to interpret and apply them.
While tutorials and webinars exist, there's limited contextual education to help users learn as they research. Beginners must invest significant time outside the platform to build the knowledge needed to use it effectively.
Annual Billing Inflexibility: Most paid plans require annual billing with no monthly option. This structure works well for professional users with predictable budgets, but creates a significant upfront commitment for individual investors who want to test whether the platform fits their needs.
These limitations aren't oversights. They're the natural result of building a comprehensive research platform for serious value investors. But they create a clear opportunity for alternatives that deliver professional-grade tools with better accessibility and value.
Top GuruFocus Alternative: Stock Unlock
Stock Unlock addresses these accessibility challenges while delivering the feature depth that serious fundamental investors need.
Rather than offering a simplified alternative to professional tools, Stock Unlock provides a complete investing toolkit; the kind of platform that experienced investors consolidate down to after years of juggling multiple subscriptions and spreadsheets.
Built by Frustrated Investors, For Investors
Stock Unlock was founded in 2021 by Daniel Pronk, a finance YouTuber with over 264,000 subscribers, and Jake Ruth, a software engineer with a decade of experience at companies like Oscar Health. The platform emerged from genuine frustration with an industry that charges too much for tools that don't always work well.
Daniel was using multiple expensive investing tools and maintaining time-consuming spreadsheets. Back in 2020, Jake, watching Daniel's videos as both an investor and engineer, grew frustrated seeing smart investors spending money on platforms with misleading scores and clunky interfaces.
He built a program to automate Daniel's spreadsheet work, shared it with Daniel's investing community, and the response was overwhelming. What started as a side project became a Y Combinator-backed company with investors in over 100 countries.
This origin story matters because it shapes the platform's priorities: most of your money when investing should go into investing, not $50/month software subscriptions. Professional-grade tools shouldn't cost an arm and a leg.
Stock Scores: Advanced Analysis Made Accessible
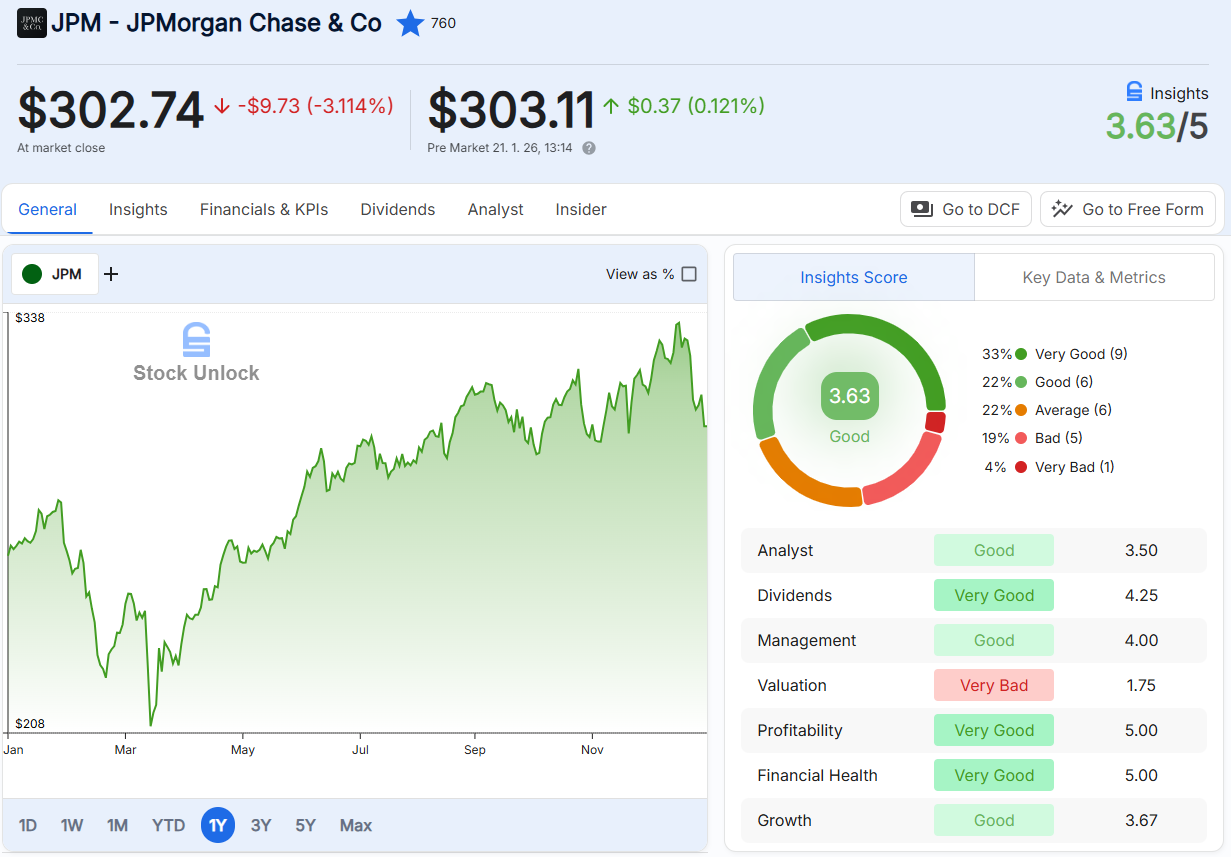
Stock Unlock's proprietary Stock Scores provide quick assessments of a company's fundamental health across seven categories: Valuation, Growth, Profitability, Dividends, Financial Health, Management, and Analyst Ratings.
These aren't generic algorithmic templates; each score is calibrated for specific industries, recognizing that the key metrics for a tech company differ from those of a financial institution or a REIT.
The scoring system has been built and battle-tested for years. Unlike competitors that may calculate "margin of safety" simply from how far a stock has fallen from its high, Stock Unlock's scores analyze actual fundamentals and are refined against real market data.
The platform ranks over 100,000 stocks by score, allowing investors to search and filter by valuation, growth, dividends, and more.
Each score appears on the stock's main page alongside an overall Stock Score, giving users an at-a-glance view of strengths and weaknesses. The interface is designed so even someone new to investing can understand it, while experienced investors appreciate the depth beneath the surface.
Portfolio Tracking That Puts Brokerages to Shame
The Portfolio Tracker is where Stock Unlock particularly shines for experienced investors.
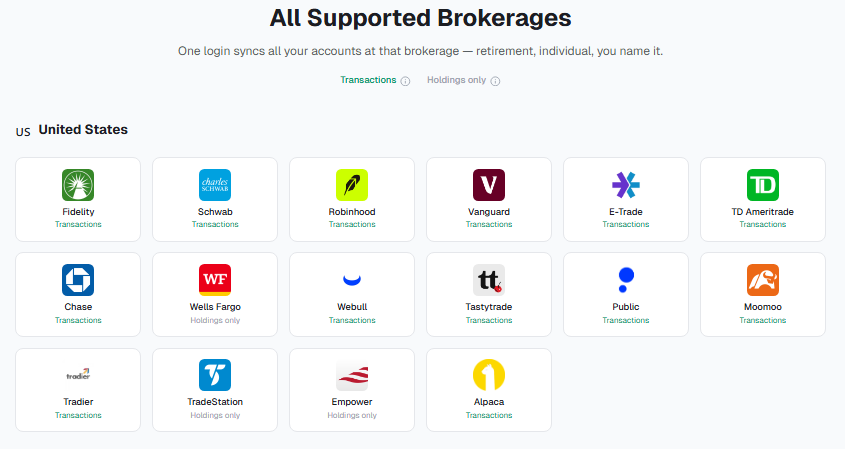
Users can connect their brokerage accounts through SnapTrade for automatic synchronization; supported brokers include Fidelity, Schwab, Robinhood, Interactive Brokers, and many others internationally. Manual entry and CSV upload are also supported.
But this isn't just basic portfolio tracking. The platform offers time-weighted returns, returns with and without dividend income, position backtesting, diversification breakdowns by sector and country, and a Portfolio Health Score derived from Stock Unlock's proprietary Stock Scores.
For dividend investors, the tools are particularly comprehensive: dividend history and forecasting charts, payout ratios, ex-dividend dates, yield tracking, and dividend growth rates, with up to 35 years of dividend history on premium plans.
Additional features include rebalancing scenarios, a portfolio calendar for tracking events, and AI portfolio analysis for instant insights. A "Privacy Mode" on the mobile app hides dollar amounts for checking portfolios on the go. For experienced investors who've been maintaining complex spreadsheets or juggling multiple tools, this consolidation provides genuine relief.
Future Stock Value Calculator with Real Flexibility
Stock Unlock's DCF Calculator (or "Future Stock Value Calculator") walks users through the valuation process with pre-populated defaults based on historical performance. Unlike traditional DCF tools that are either too complex for most investors or oversimplified to the point of being misleading, Stock Unlock's calculator balances power with usability.
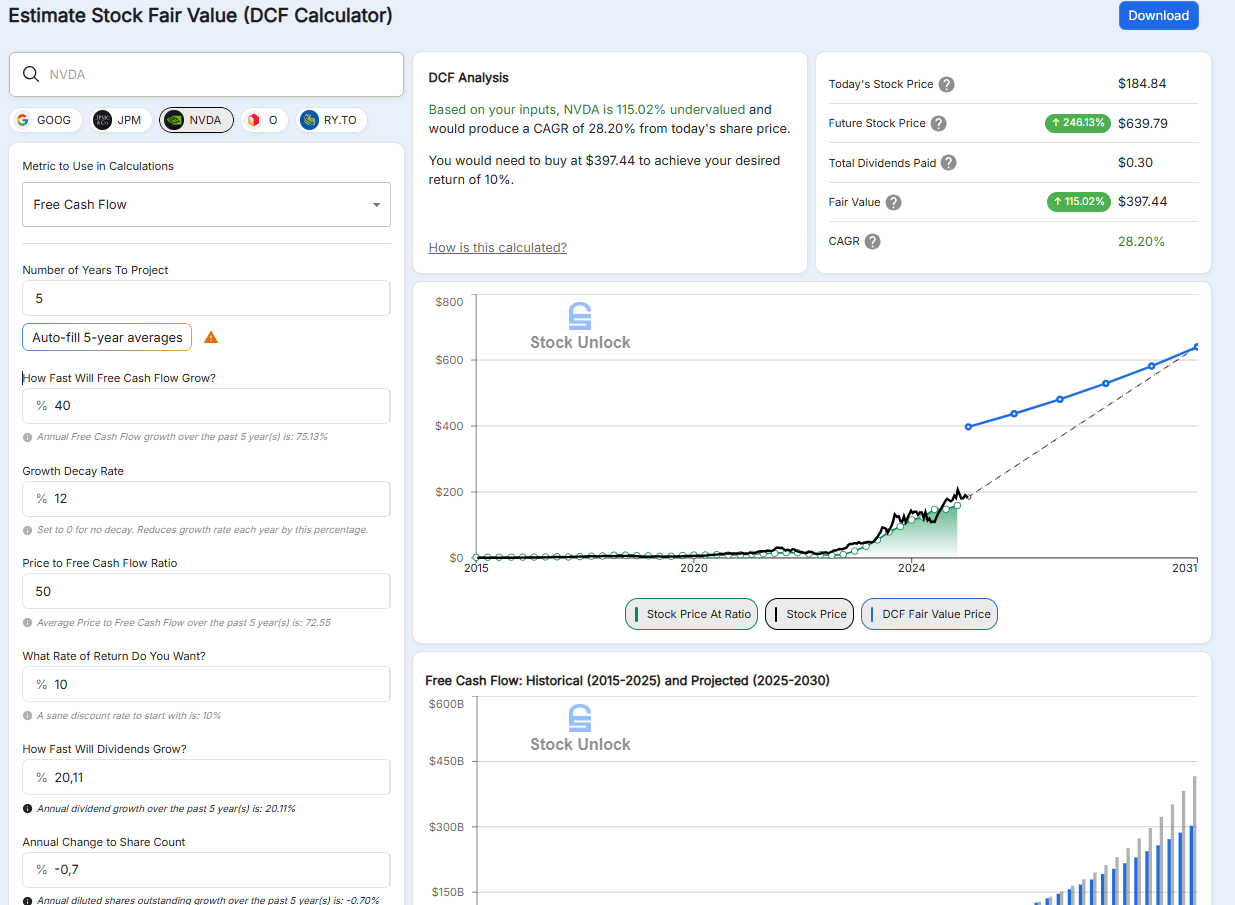
The tool projects across seven different financial metrics, where most competitors hardcode just one or two, and allows users to model dividend growth and diluted shares outstanding.
A growth decay feature gives investors more control, preventing CAGR projections from ballooning unrealistically. Results include the calculated fair value, upside or downside potential, and a visual graph comparing current price to the fair value line.
Education Built Into Every Screen
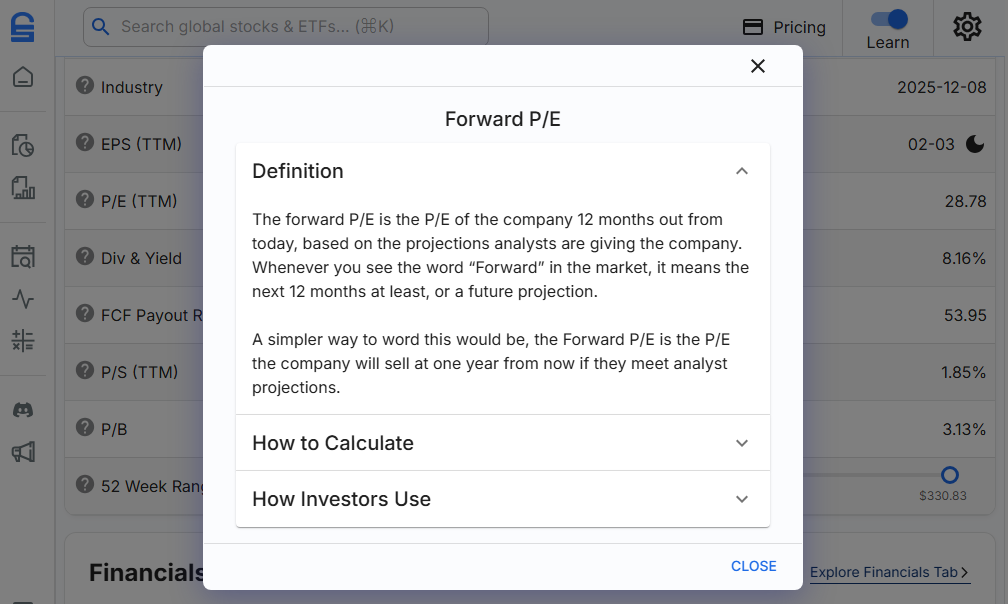
For investors who want to strengthen their fundamental analysis skills, Stock Unlock offers "Learn Mode", an integrated educational system that transforms the platform into a learning experience. When activated, question mark icons appear next to financial metrics throughout the interface. Clicking these reveals explanations of what each metric means and why it matters.
This contextual education means users don't need to leave the platform to research unfamiliar terms. The approach serves as "training wheels" for newer investors while experienced investors can toggle Learn Mode off for a cleaner interface. It's one way Stock Unlock bridges the gap between accessibility and professional-grade depth.
Complete Global Coverage
Stock Unlock covers 170,000+ stocks and ETFs across 70+ global exchanges, including NYSE, NASDAQ, TSX, LSE, Tokyo, and Frankfurt. Historical financials extend up to 35 years on premium plans, five years more than GuruFocus offers. The platform is available on web, iOS, and Android, with full syncing across devices.
Pricing That Respects Your Investment Capital
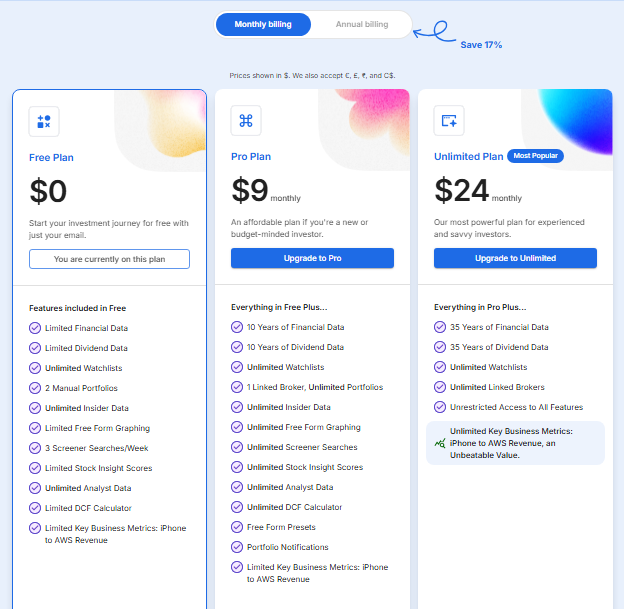
Stock Unlock offers a permanent free tier that includes limited financial and dividend data, manual portfolios, watchlists, and access to the stock screener. Unlike a trial, this free plan has no time limit, and free accounts can connect one brokerage account free for 15 days to test the full experience.
The Pro plan at $7.50/month (billed annually) unlocks 10 years of data, unlimited screener results and filters, linked brokers, and unlimited portfolios. The Unlimited plan at $20/month provides 35 years of data, expanded brokerage connections, and access to all current and future features. Monthly billing options are available for those who prefer flexibility. All paid plans include a 30-day money-back guarantee.
GuruFocus or Stock Unlock: Comparison Summary
| Aspect | GuruFocus | Stock Unlock |
|---|---|---|
| Primary Focus | Professional-grade value investing research | Complete investing toolkit with built-in education |
| Target Users | Financial advisors, analysts, serious investors | Experienced investors consolidating tools; committed new investors |
| Ease of Use | ⭐⭐ Dated interface, steep learning curve | ⭐⭐⭐⭐⭐ Clean interface, Learn Mode available |
| Historical Data | Up to 30 years | Up to 35 years |
| Stock Coverage | 100,000+ stocks, 100 markets | 170,000+ stocks and ETFs, 70+ exchanges |
| Screener Filters | 500+ filters | 85+ focused filters |
| Guru Tracking | ⭐⭐⭐⭐⭐ 8,000+ institutional investors | Not available |
| Proprietary Scoring | GF Score (0-100, five factors) | Stock Scores (7 categories, industry-calibrated) |
| Portfolio Tracking | Basic tracking with Excel integration | Advanced: dividend forecasting, Portfolio Health Score, AI analysis |
| Dividend Analysis | Included | Comprehensive: 35-year history, forecasting, payout analysis |
| Mobile Apps | iOS available | iOS and Android |
| Free Plan | Limited free tier | ✅ Permanent free tier with 15-day brokerage trial |
| Entry Pricing | $499/year minimum | $90/year (Pro) |
| Billing Options | Annual only | Monthly or annual |
| Money-Back Guarantee | Not specified | 30-day guarantee |
| Best For | Maximum data depth, guru tracking | Complete toolkit, consolidation, value pricing |
Final Verdict
The choice between GuruFocus and Stock Unlock depends on your specific needs, experience level, and what you value most in an investment platform.
Choose GuruFocus if you're a serious value investor who wants maximum analytical depth and the ability to track what legendary investors are buying and selling.
The platform excels when you have the time to master its comprehensive features and the budget for a premium research tool. Its extensive guru tracking, 30 years of historical data, and 500+ screener filters make it a powerful resource for those who will use its full capabilities. Financial advisors and professional analysts will find the depth of data and Excel integration particularly valuable.
Get started with GuruFocus here.
Choose Stock Unlock if you want professional-grade fundamental analysis tools without the complexity, excessive cost, or scattered subscriptions.
Experienced investors find relief in consolidating from multiple expensive platforms or time-consuming spreadsheets into one cohesive toolkit. Committed new investors benefit from Learn Mode and an interface that doesn't require weeks to master.
With 35 years of historical data, industry-calibrated Stock Scores, comprehensive dividend analysis, and a complete portfolio tracker, all at a fraction of the cost, Stock Unlock delivers the complete package that fundamental investors need without charging an arm and a leg for it.
Try Stock Unlock free, no credit card required.
Both platforms serve investors who prioritize fundamental analysis over speculation. GuruFocus offers unmatched depth for professionals with time and budget to spare. Stock Unlock provides the complete investing toolkit for investors who believe their money should go into investments, not software subscriptions, and who want tools that actually work.
Try Stock Unlock Free
No credit card required. 15-day free brokerage trial. 30-day money-back guarantee on paid plans.
Get Started for Free