Stock Rover has built a reputation as a comprehensive investment analysis platform available to retail investors. With over 700 financial metrics, powerful screening capabilities, and robust portfolio analysis tools, it offers a significant level of depth for fundamentally focused investors who want to dig deep into financial data.
This Stock Rover review offers an extensive analysis of the platform. It may be the ideal choice if:
- You're an experienced investor comfortable with data-intensive interfaces
- You need powerful screening with hundreds of customizable metrics
- Your investment focus is primarily on North American markets
- You want institutional-grade portfolio analytics and correlation analysis
- You prefer a spreadsheet-like environment for detailed comparisons
However, Stock Rover might not be the best choice if:
- You prefer a clean interface that delivers depth without unnecessary complexity
- You want industry-specific scoring methodology alongside full financial data
- You need coverage beyond North American markets, with up to 35 years of historical data
- You want integrated education alongside your analysis, not as a separate product
- You value having a dedicated mobile app for investing on the go
- You don't want to pay premium prices for SaaS software
In this case, you should consider Stock Unlock: an investment platform built out of genuine frustration with expensive, inadequate tools that charge too much and deliver too little. Backed by Y Combinator, Stock Unlock combines proprietary Stock Scores that actually work, coverage of over 170,000 stocks and ETFs across 70+ global exchanges, and an integrated Learn Mode that explains financial concepts as you invest. The result is the complete investment toolkit at a fraction of what competitors charge, with a generous free tier that lets you experience the platform before spending a dollar.
This review includes a detailed look at Stock Unlock later on. Those ready to explore a more accessible approach to investment analysis can get started with Stock Unlock for free here.
Table of contents:
What is Stock Rover?
Stock Rover is a web-based investment analysis platform founded in 2008 by Howard Reisman and Andrew Martin.
Both founders are software engineers and long-time individual investors who were frustrated with the fragmented tools available for personal investment analysis. They found themselves using multiple websites, browser tabs, and spreadsheets to perform the in-depth analysis they needed, and set out to build an integrated solution.
Today, Stock Rover provides data on over 8,500 North American stocks, 4,000 ETFs, and 40,000 mutual funds. The platform's core strength lies in its comprehensive screening capabilities, detailed portfolio analytics, and extensive historical financial data. Depending on the subscription plan, users can access between 275 and 700+ financial metrics with up to 10 years of detailed history.
Stock Rover is particularly known for its powerful screener, which allows users to filter stocks using hundreds of criteria simultaneously. The platform also offers portfolio management tools with brokerage integration, correlation analysis, dividend income projections, and Monte Carlo simulations for future performance modeling.
The typical Stock Rover user is a serious, self-directed investor who prioritizes fundamental analysis and takes a long-term approach to investing. Value investors, dividend investors, and those who enjoy detailed financial statement analysis will find the platform aligns well with their analytical style.
Stock Rover Pros & Cons
| Pros | Cons |
|---|---|
| ✅ Powerful screener with 700+ filterable metrics | ❌ Steep learning curve for new users |
| ✅ Up to 10 years of detailed historical data | ❌ Limited to North American markets only |
| ✅ Comprehensive portfolio analytics and correlation tools | ❌ No dedicated mobile application |
| ✅ Brokerage integration with 1,000+ institutions | ❌ Analyst reports require additional purchase |
| ✅ Highly customizable views and reports | ❌ Interface can feel dense and overwhelming |
| ✅ Generally positive reputation for data accuracy |
Stock Rover Review: How it Works & Key Features
Screeners: Finding Investment Opportunities Through Detailed Filtering
Stock Rover's screener is often cited as its standout feature.
The platform offers over 140 pre-built screeners covering investment strategies like value investing, dividend growth, and momentum. Users can also build custom screeners from scratch using any combination of available metrics.
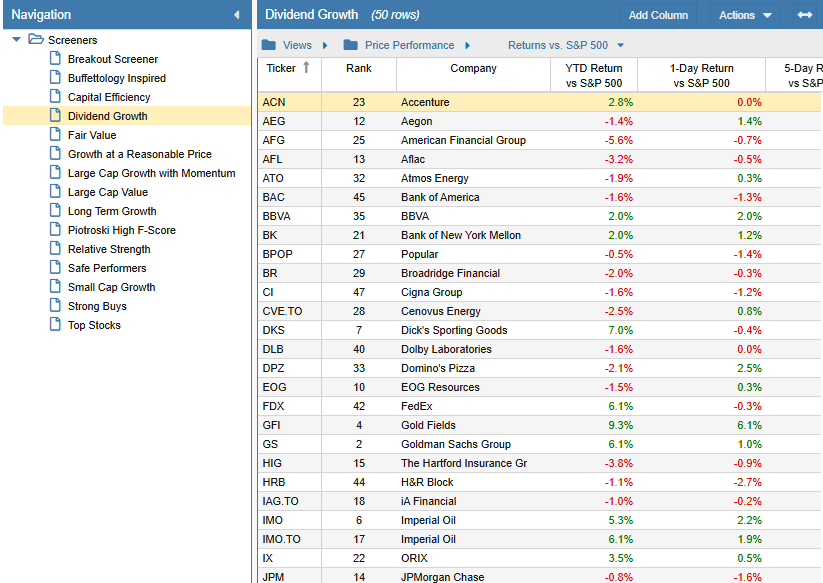
The filtering options cover valuation ratios (P/E, P/S, P/B, EV/EBITDA), growth metrics (revenue growth, EPS growth), profitability measures (ROE, ROIC, margins), financial health indicators (debt-to-equity, current ratio), and dividend data (yield, payout ratio, growth rate).
Premium Plus subscribers can access equation-based screening, which allows users to create custom formulas combining multiple metrics.
A notable capability is historical data screening. Users can filter for companies that have demonstrated consistent performance over time, such as five consecutive years of earnings growth or sustained dividend increases. This feature supports investors who want to identify companies with proven track records rather than just current snapshots.
The Table: Spreadsheet-Style Data Analysis
The Table functions as Stock Rover's central workspace for viewing and analyzing financial data. It operates like an advanced spreadsheet populated with financial metrics, where each row represents a stock and each column represents a specific data point.
Users can create custom "Views," which are saved column configurations tailored to specific analytical needs. Stock Rover provides pre-built views for valuation, growth, profitability, and dividends, but users can build their own with any combination of the 700+ available metrics.
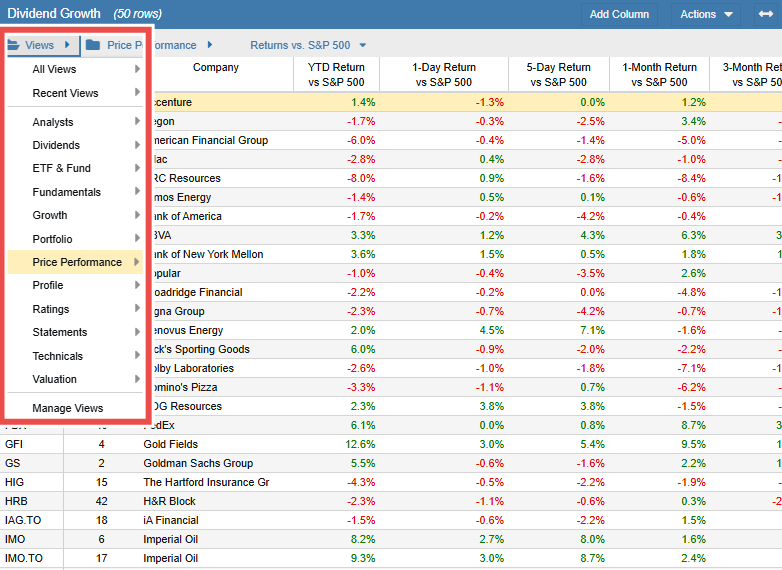
The Table supports multi-level sorting, advanced filtering, and color-coding for visual organization.
Data can be loaded from portfolios, watchlists, screener results, or market indices like the S&P 500. This flexibility allows users to analyze their holdings alongside screener results or benchmark components in a single view. The Table also supports data export to CSV for further analysis in spreadsheet applications.
Portfolio Management: Tracking and Analyzing Your Investments
Stock Rover's portfolio management suite offers both brokerage integration and manual entry options.
Through a partnership with Yodlee, users can connect accounts from over 1,000 financial institutions for automatic syncing. The connection is read-only, meaning Stock Rover can view holdings but cannot execute trades.
The Portfolio Analytics feature provides detailed performance metrics including returns over various time periods, risk-adjusted measures like Sharpe Ratio, and comparisons against benchmarks. The correlation analysis tool shows how portfolio holdings move relative to each other, helping investors assess diversification.
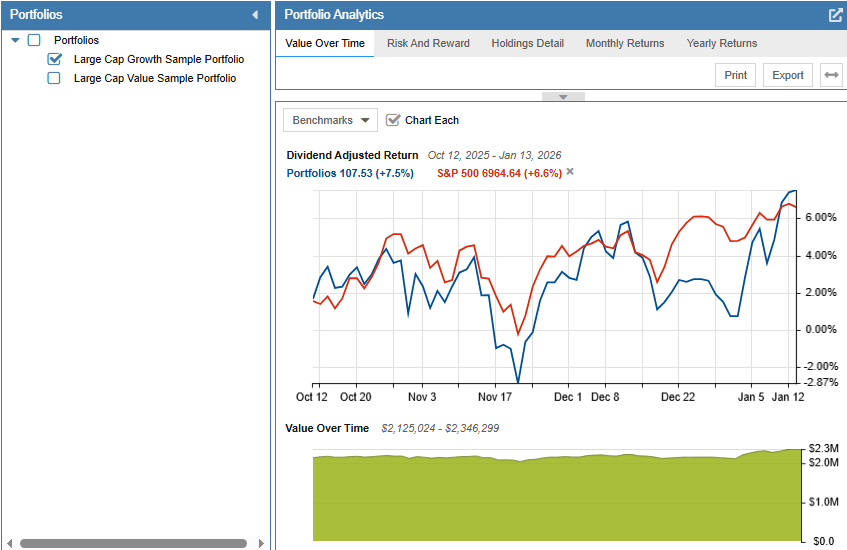
For dividend investors, the Future Income tool projects expected dividend payments over the coming months based on current holdings and historical payment patterns. The rebalancing tool helps investors maintain target asset allocations by calculating the trades needed to restore balance.
The Future Simulations feature uses Monte Carlo analysis to model potential portfolio outcomes under various market scenarios. Users can adjust parameters like simulation years, market conditions, and contribution rates to understand the range of possible results.
Charting: Visualizing Price and Fundamental Data
Stock Rover's charting capabilities extend beyond basic price charts.
Users can overlay fundamental metrics onto price charts, with over 100 chartable financial data points available. This allows for visual analysis of how metrics like P/E ratio or revenue growth have correlated with stock price movements over time.
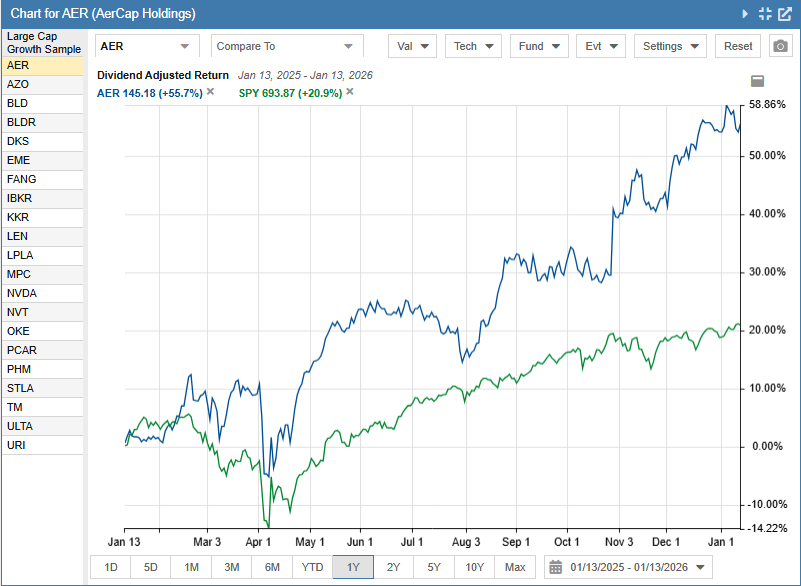
The comparative charting feature supports plotting multiple stocks or ETFs on the same chart for performance comparison. Users can set any ticker as a "baseline" to see relative performance more clearly. Technical indicators including moving averages, Bollinger Bands, RSI, and MACD are available for those who incorporate technical analysis.
Stock Rover also offers specialized valuation charts. The "Football Field" chart displays how current valuation metrics compare to their historical ranges across multiple ratios simultaneously. Ratio charts allow users to track the relationship between two different metrics or two different stocks over time.
Where Stock Rover Falls Short
While Stock Rover delivers substantial analytical power, several limitations become apparent with regular use. These are worth considering before committing to the platform.
Complexity and Learning Curve: The extensive feature set that makes Stock Rover powerful also makes it challenging for newcomers. The spreadsheet-like interface, with its dense data presentation and numerous configuration options, can be intimidating for investors who are not already comfortable with detailed financial analysis. Users frequently report needing significant time investment to fully leverage the platform's capabilities, and there is no built-in educational layer to help bridge that gap. You're expected to already understand what every metric means.
North American Market Limitation: Stock Rover's data coverage is limited to approximately 8,500 U.S. and Canadian stocks, along with about 4,000 ETFs and 40,000 mutual funds. Investors seeking to analyze international stocks, emerging markets, or build globally diversified portfolios will need additional tools. For context, platforms with broader coverage track 170,000+ stocks and ETFs across 70+ exchanges worldwide.
Generic Stock Scoring: Stock Rover offers a stock ratings system, but it applies the same scoring formula across all sectors. A technology company is evaluated using the same criteria as a utility or a bank. Industry-specific nuances, like why high R&D spending is healthy for tech but unusual for utilities, aren't reflected in the scores. Investors relying on these ratings may miss important context about what "good" looks like in different industries.
Historical Data Ceiling: Stock Rover provides up to 10 years of historical financial data. For investors who want to analyze how a company performed across multiple economic cycles, recessions, or long-term secular trends, that window can feel limiting. Longer historical datasets (some platforms offer up to 35 years) allow for more robust backtesting and pattern recognition.
Dated Interface: Stock Rover's interface has remained largely unchanged since the platform launched in 2008. While functional, the design can feel dated compared to modern investment platforms. Dense layouts and small text are workable on large desktop monitors, but the experience hasn't kept pace with current UX standards.
No Dedicated Mobile App: Stock Rover is a web-based platform without native mobile applications for iOS or Android. While the website is mobile-responsive, the data-intensive interface is challenging to use effectively on smaller screens.
Add-On Costs: While Stock Rover offers monthly, annual, and two-year billing options, some features require additional purchases. Analyst reports cost extra on top of subscription fees, and prioritized phone support is available as a paid add-on. These separated costs require careful evaluation when comparing total value.
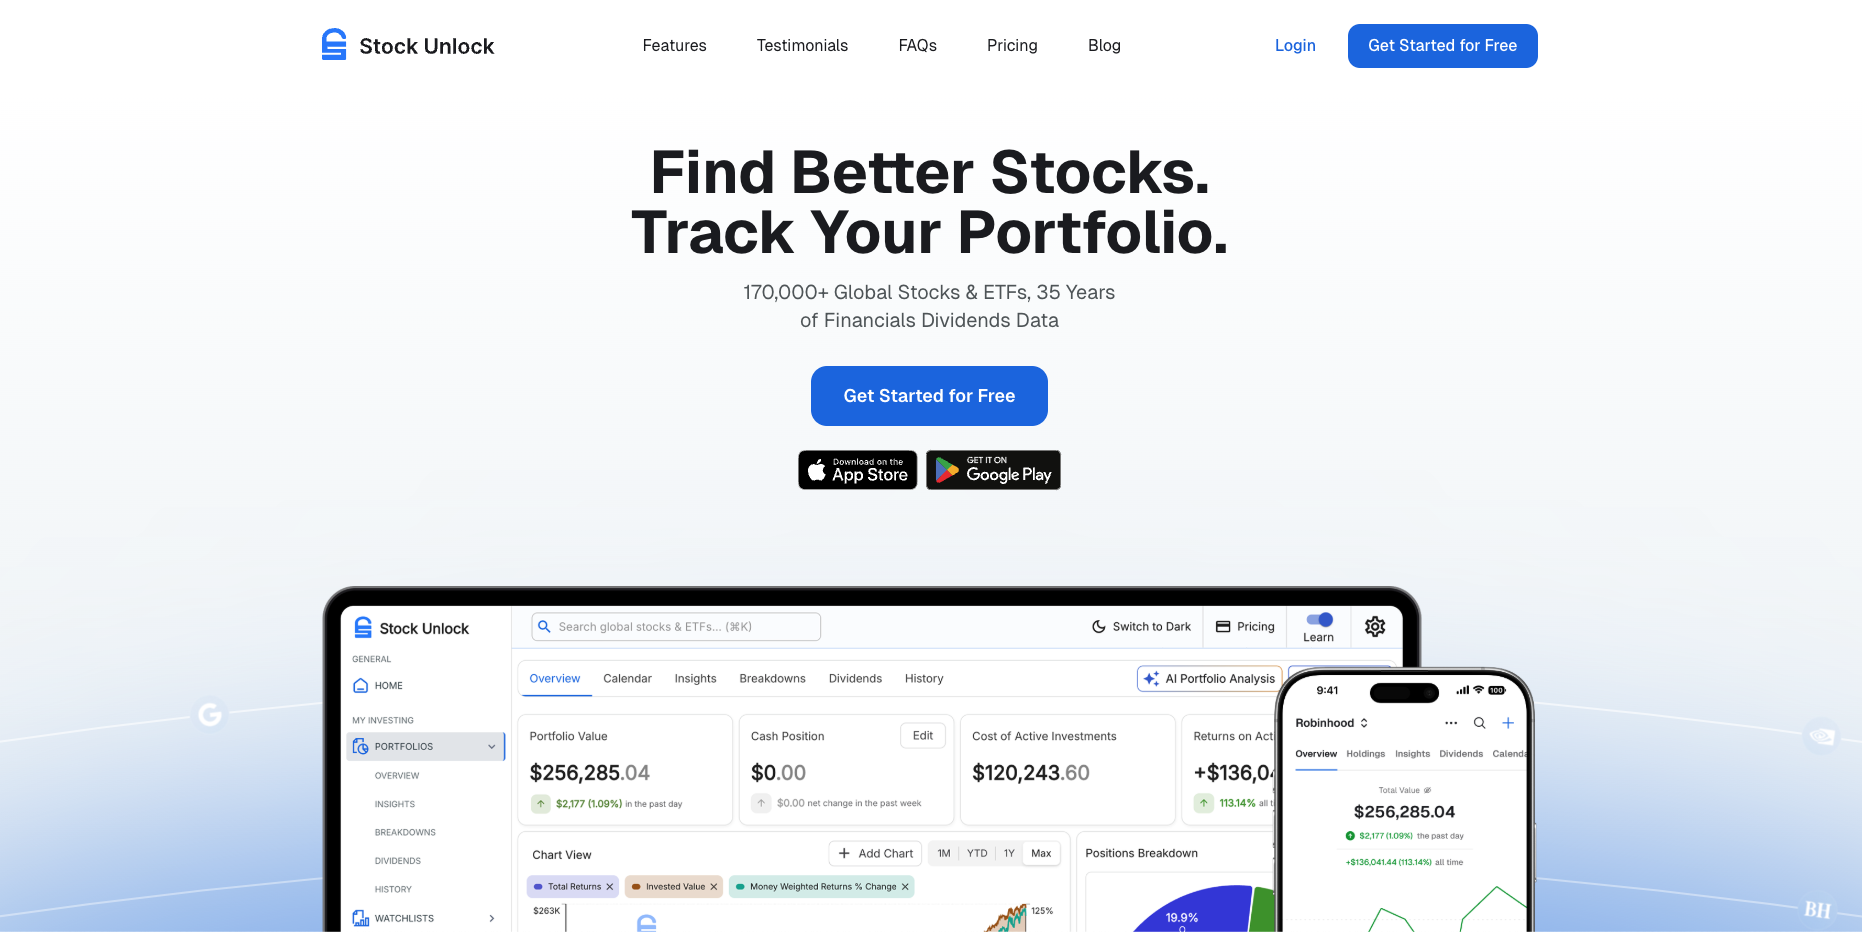
Top Stock Rover Alternative: Stock Unlock
Stock Unlock represents a different philosophy in investment analysis: the belief that professional-grade analysis tools should be accessible without premium pricing, and that most of your money should go into investing, not expensive software subscriptions.
Backed by Y Combinator and trusted by investors worldwide, Stock Unlock delivers the complete investment toolkit in one cohesive platform.
Where many investors find themselves juggling multiple subscriptions, maintaining time-consuming spreadsheets, or settling for tools that charge too much for too little value, Stock Unlock consolidates everything into a single, intuitive experience.
Built From Frustration, Not a Business Plan
Stock Unlock's origin story sets it apart.
Co-founder Daniel Pronk, known for his investing education YouTube channel with over 264,000 subscribers (as of January 2026), was spending 5-8 hours weekly creating spreadsheets to analyze stocks for his videos. He was also using multiple expensive tools that still didn't give him what he needed. Jake Ruth, a software engineer watching Daniel's content, saw this inefficiency and built a program to automate the spreadsheet work.
After persistent outreach across multiple platforms that bordered on harassment, Jake finally connected with Daniel, and what started as a side project became a mission: build the investment platform they wished existed.
The platform launched in December 2021, driven by genuine frustration with an industry that charges premium prices for inadequate tools. Stock Unlock was built by investors who believe retail investors deserve better.
Who Stock Unlock Serves Best
Stock Unlock is purpose-built for two types of investors.
First, experienced investors who have been using multiple analysis tools or maintaining messy spreadsheets for years. These users often discover Stock Unlock and find relief: a single platform that consolidates portfolio tracking, screening, scoring, dividend analysis, and valuation tools into one cohesive experience.
Quality-of-life features like dividend forecasting, AI portfolio analysis, diversification breakdowns, and a portfolio calendar that actually works make it clear this was built by investors for investors.
Second, committed new investors who have decided that building an investment portfolio is a meaningful driver of long-term wealth. Not casual investors chasing the latest hype, but people who want to learn how to invest properly.
Stock Scores That Actually Work
Many platforms use generic algorithmic scores: single formulas applied identically to every stock regardless of industry. Some even calculate "margin of safety" simply from how far a stock has fallen from its high, which can be dangerously misleading.
Stock Unlock's proprietary Stock Scores take a different approach. The system analyzes and grades stocks across seven categories: Analyst, Valuation, Growth, Profitability, Dividends, Financial Health, and Management. Crucially, these scores are industry-specific; the metrics that define a healthy technology company differ from those for a financial institution or utility.
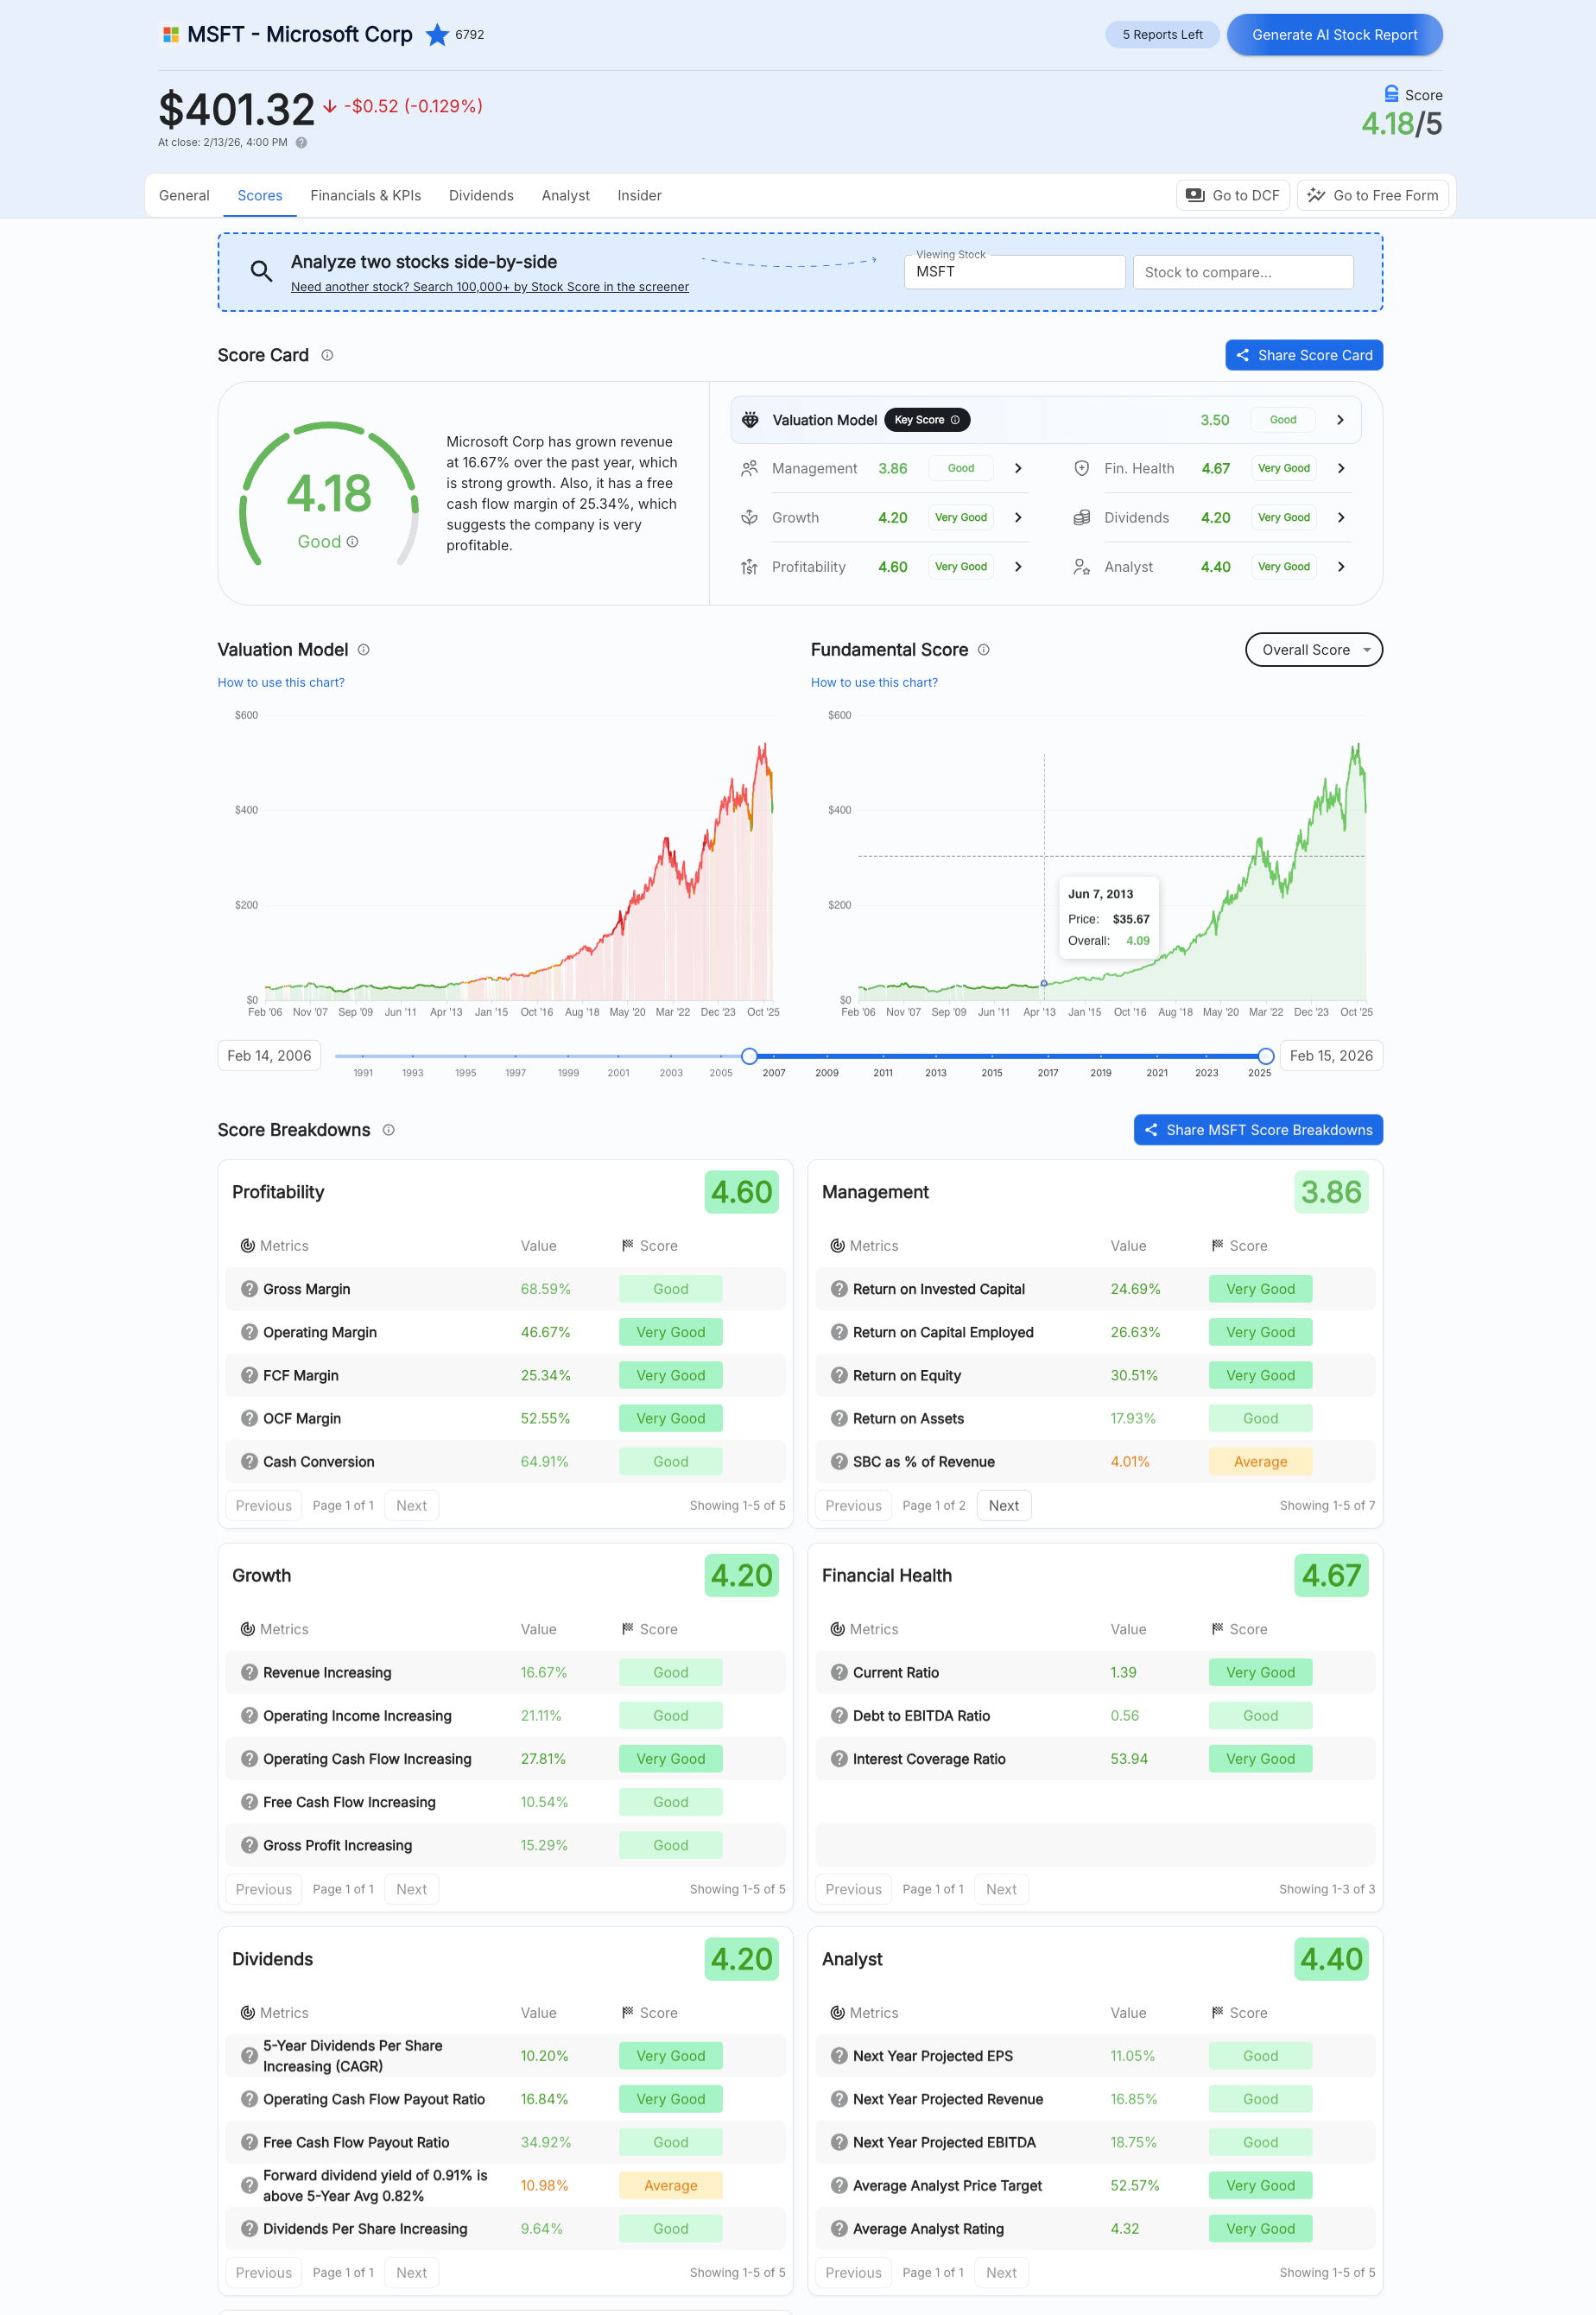
This isn't a basic single algorithm for every stock; it's an advanced scoring system built and refined over years, designed to help you find great investments and, just as importantly, avoid bad ones. You can read more about how the scoring methodology works.
The scores integrate directly into Stock Unlock's advanced stock screener, which covers the full global market. Users can filter by proprietary scores alongside traditional metrics, quickly narrowing down to fundamentally sound businesses without manually analyzing dozens of individual data points.
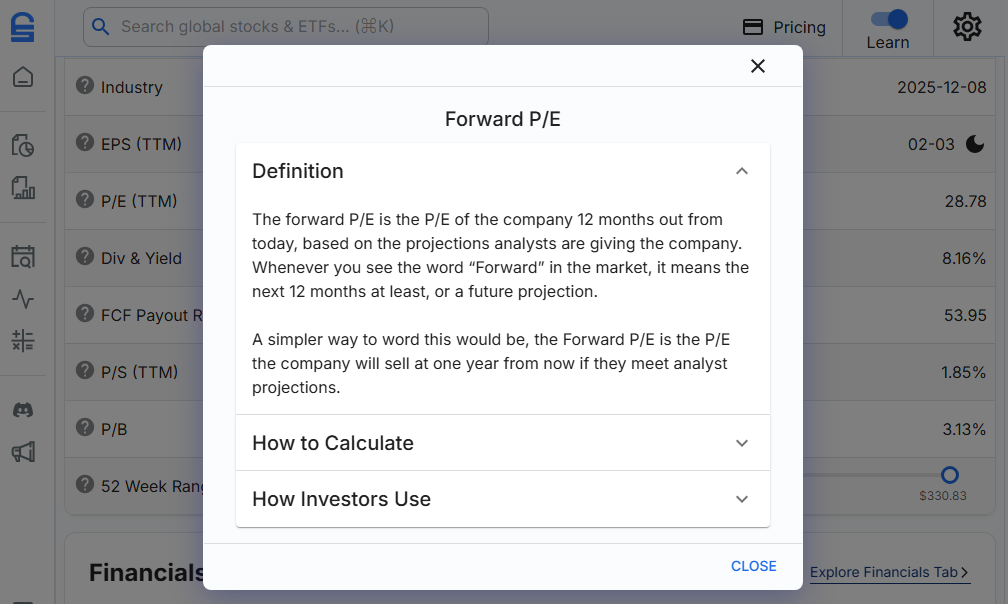
Learn Mode: Education Where You Need It
Traditional investing education happens separately from actual analysis. Stock Unlock's Learn Mode changes this by embedding education directly into the platform.
When activated, clickable icons appear next to financial terms and metrics throughout the interface, revealing explanations of what each metric means, how it's calculated, and how investors typically use it.
This contextual approach means users learn while actively analyzing stocks, not by studying separately before they can get started. It's particularly valuable for investors who weren't taught financial literacy in school (which, let's be honest, is most of us).
For experienced investors who don't need the guidance, Learn Mode toggles off for a cleaner interface with a single button click.
Global Coverage and Complete Portfolio Tracking
Unlike Stock Rover's North American focus, Stock Unlock covers over 170,000 stocks and ETFs across more than 70 global exchanges: NYSE, NASDAQ, London Stock Exchange, Tokyo Stock Exchange, Frankfurt, and many more. Investors building globally diversified portfolios can analyze everything from one platform.
The portfolio tracker supports brokerage synchronization through SnapTrade, connecting to major brokerages including Fidelity, Schwab, Robinhood, Questrade, and Interactive Brokers. Manual entry and CSV upload are also available.
Source: Stock Unlock
Portfolio dashboards display performance metrics, diversification breakdowns by holdings, industries, and countries, plus a Portfolio Health Score derived from Stock Unlock's proprietary scoring system. The stock comparison tool lets you put companies head to head across 80+ metrics, overlaying the same data points to see who's growing faster at a glance.
Dividend tracking goes deeper than most platforms, with income forecasting, payment history visualization, yield analysis, and dividend safety scoring. For dividend investors, Stock Unlock's dividend tools offer more ways to visualize and understand income than most alternatives.
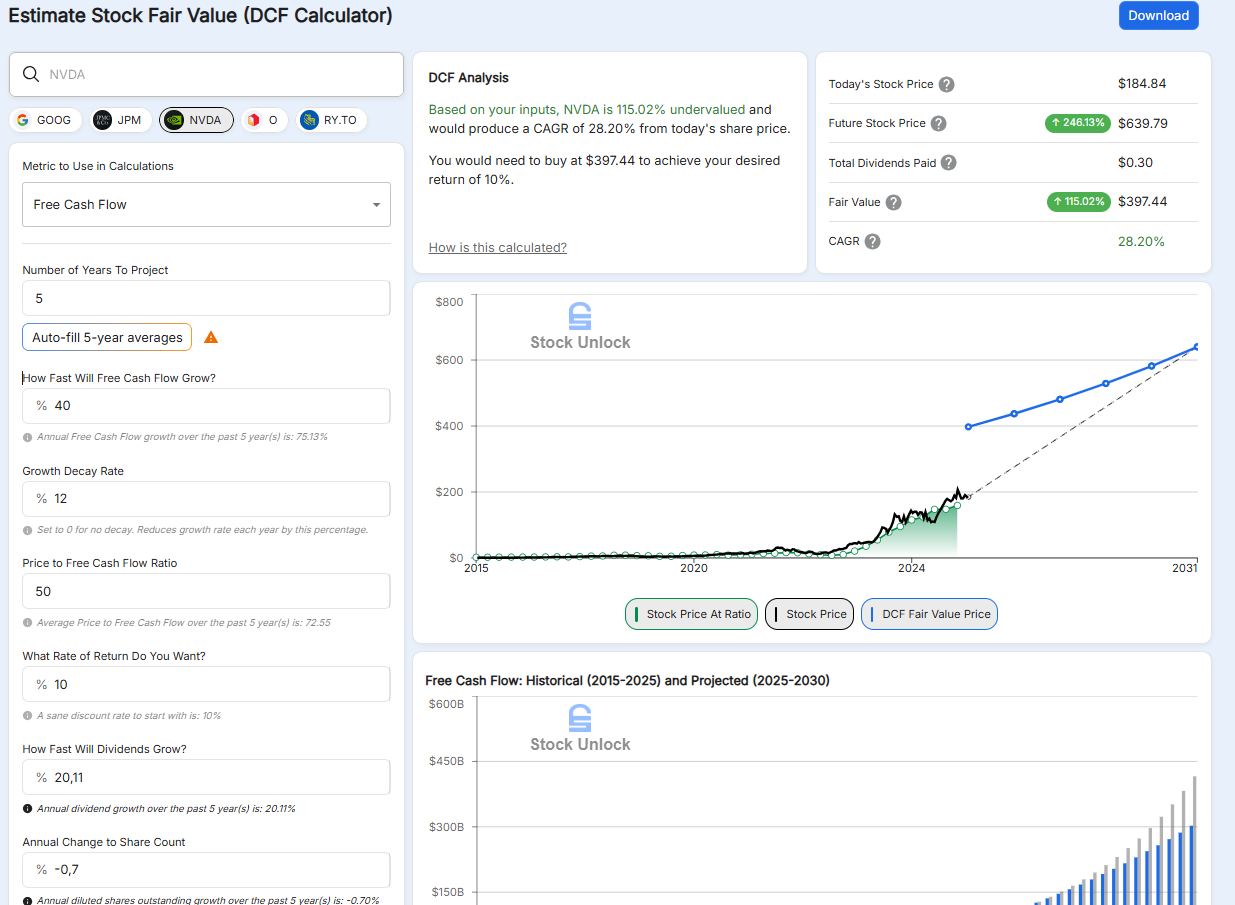
A Future Stock Value Calculator Anyone Can Use
Stock Unlock's future stock value calculator helps users estimate fair value for stocks based on growth assumptions and trading multiples.
Unlike traditional DCF (Discounted Cash Flow) tools that are either too complex for non-professionals or too simplified to be useful, this calculator projects across seven different metrics and allows modeling of dividend growth and diluted shares outstanding.
Historical data pre-fills sensible starting points, making valuation analysis accessible to everyday investors while maintaining professional-grade depth.
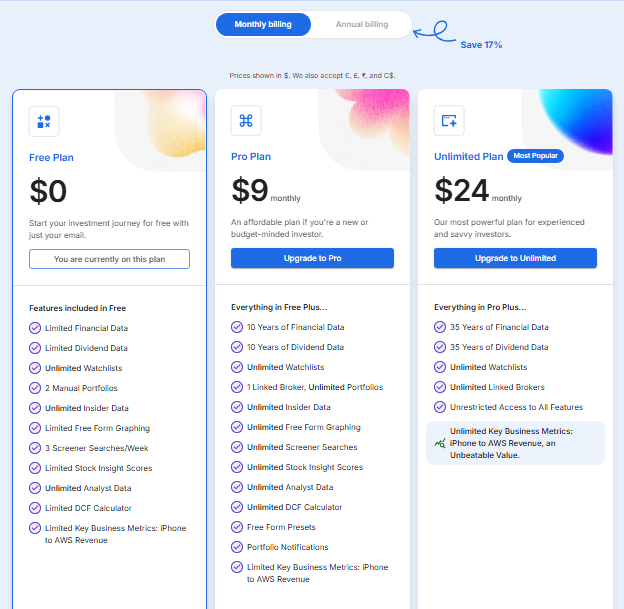
Pricing That Respects Your Investment Capital
Stock Unlock operates on a simple philosophy: your money should go into investing, not expensive software subscriptions. The platform offers three tiers:
- Free: Limited financial data, two manual portfolios, basic screener access. Free accounts also get 15 days of brokerage connection at no cost, no credit card required, so you can test the full experience before committing.
- Pro ($7.50/month annually): 10 years of historical data, brokerage sync, unlimited screener access, full Stock Scores system.
- Unlimited ($20/month annually): 35 years of historical data, multiple brokerage connections, all features without restrictions.
All paid plans include a 30-day money-back guarantee. The free tier is permanent, not a limited trial designed to pressure you into upgrading.
Stock Unlock also offers native mobile apps for iOS and Android, syncing seamlessly with your web account.
Source: Stock Unlock
Aligned Incentives: They Win When You Win
Traditional brokerages profit from more assets under management and more trading activity, even though excessive trading typically hurts investor returns.
Stock Unlock's incentives are fundamentally different: the platform succeeds when users avoid bad stocks and grow their wealth. There's no pressure to trade more, no proprietary funds to push. As user reviews consistently note, helping investors avoid losing stocks is just as valuable as helping them find winning ones.
Stock Rover or Stock Unlock: Comparison Summary
| Aspect | Stock Rover | Stock Unlock |
|---|---|---|
| Best For | Experienced investors wanting maximum data depth | Long-term investors seeking the complete toolkit |
| Learning Curve | ⭐⭐ Steep, significant time investment required |
⭐⭐⭐⭐⭐ Gentle, with integrated Learn Mode |
| Market Coverage | North American markets only | 70+ global exchanges |
| Screener Metrics | 700+ metrics | 85+ filters with proprietary Stock Scores |
| Stock Scoring | Stock Ratings system | Industry-specific scores across 7 categories |
| Historical Data | Up to 10 years | Up to 35 years |
| Mobile App | No dedicated app | iOS and Android apps |
| Free Tier | Limited, ad-supported | Generous, with 15-day brokerage trial |
| Brokerage Trial | Not available | 15 days free, no credit card required |
| Money-Back Guarantee | Not specified | 30 days |
| Starting Paid Price | $7.99/month | $7.50/month |
| Backing | Independent | Y Combinator, Goodwater Capital |
Final Verdict
The choice between Stock Rover and Stock Unlock depends on your experience level, analytical style, and what you need from an investment platform.
Choose Stock Rover if you're an experienced investor who is comfortable navigating complex, data-intensive interfaces and focused primarily on North American markets.
The platform is built for users who conduct detailed fundamental analysis, compare stocks across hundreds of metrics simultaneously, and prefer a spreadsheet-style environment. Be prepared to invest significant time learning the platform's capabilities before seeing its full value.
Get started with Stock Rover here.
Choose Stock Unlock if you want the complete investment toolkit without paying a premium for it, or if you're tired of juggling multiple subscriptions that still don't give you what you need.
The platform serves both experienced investors looking to consolidate their tools and committed new investors who want to learn fundamentals-based investing properly. Stock Scores that actually work (not generic algorithms), global market coverage, integrated education, dividend forecasting, and quality-of-life features make it a platform you can use productively from day one.
Users who take time to explore often discover value they never knew existed, and the subscription cost pales in comparison to the returns from making better investment decisions.
Get started with Stock Unlock free, no credit card required.
Stock Rover offers data depth and customization, but at the cost of accessibility, global coverage, and modern UX. Stock Unlock delivers the complete package: professional-grade tools at accessible prices, built by investors who believe retail investors deserve better.
Your best choice depends on which tradeoffs matter most to you.
Try Stock Unlock Free
No credit card required. 15-day free brokerage trial. 30-day money-back guarantee on paid plans.
Get Started for Free