See If Any Stock Is
Cheap or Expensive
Our Valuation Score picks the most reliable valuation ratios for each stock individually, compares them against their own historical averages and expected growth, and tells you if the stock looks cheap or expensive. One score, 1-5.
Get Started for Free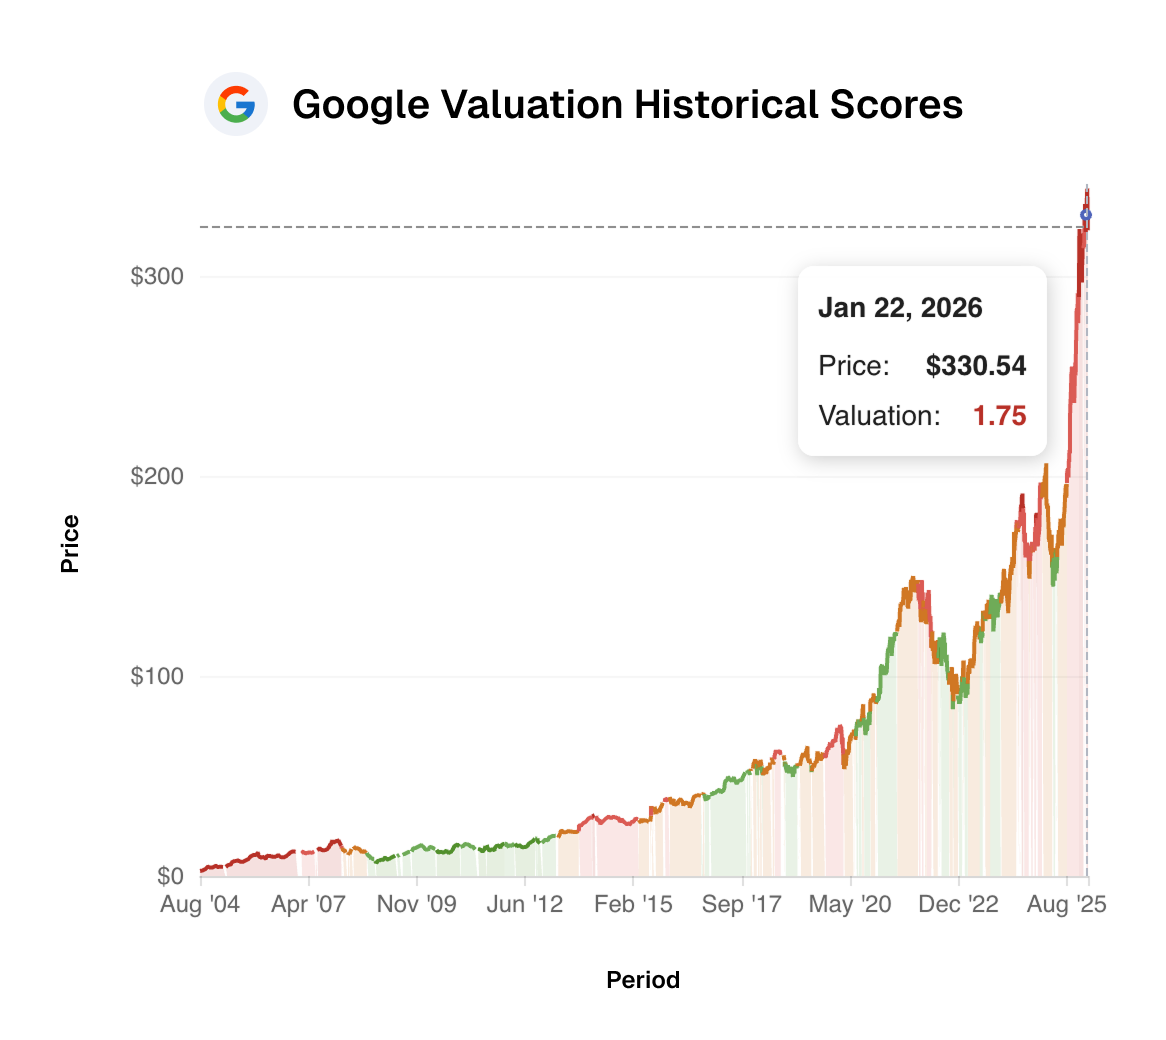
Valuation Is the Most Important
Question in Investing
Most investors either skip valuation entirely or rely on a
single metric like P/E. One ratio without
context
is misleading.
The Single-Metric Trap
- One ratio tells you nothing alone
- No industry context
- No historical comparison
The Full Picture
- Per-stock metric selection vs. historical averages
- Adapts to each company automatically
- Updates as prices move throughout the day
Every Stock Score combines two components: the Valuation Score (is the price right?) and 6 fundamental categories that assess the health of the business. All 7 are equally weighted.
Explore all Stock ScoresUpdates Throughout the Day
Reacts to price changes throughout the day
Per-Stock Calibration
The right ratios for each company
Up to 35 Years of Data
Point-in-time historical accuracy
Not All Stocks Are Valued the Same Way
A P/E ratio means nothing for a REIT. Net Interest Margin is irrelevant for a tech company. Our Valuation Model uses the right metrics for every industry.

NVIDIA
Semiconductors

Realty Income
Retail REITs
Our algorithm automatically selects the right valuation metrics for each of the 100,000+ stocks we score
What's Under the Hood
The Valuation Score doesn't just check one ratio. It evaluates price multiples, adjusts for growth rates, and compares everything against historical averages, all calibrated per stock.
Valuation Breakdown
A $500 Stock Can Be Cheap
Price alone tells you nothing. Our Valuation Score compares each stock to its own history, so "cheap" and "expensive" are relative to what the market normally pays for that stock.
Multiple valuation metrics flag it as expensive relative to its own price history. Low price doesn't mean cheap.
The most reliable multiples for this stock all point to undervalued. High price doesn't mean expensive.
A low valuation does NOT mean sell. There may be good reasons a stock trades at a premium. This is context, not a trading signal. Investors should always perform their own due diligence.
See It In Action
Search for any stock and see how it scores across all 7 categories.
Common Questions About the Valuation Score
How we determine whether a stock is cheap or expensive
What is the Valuation Score?
The Valuation Score is one of 7 equally weighted categories in our Stock Scores system, and it's the most unique. It shows how a company's current valuation stacks up against its historical price ratios and expected future growth. The model selects the most statistically reliable valuation multiples for each stock, compares them against their own historical averages, and factors in growth-adjusted ratios so a fast-growing tech stock isn't judged the same way as a slow-growing dividend payer. The result is a simple 1-5 score: 5 means deeply undervalued, 1 means deeply overvalued.
How does the model choose which valuation ratios to use?
The algorithm runs a series of statistical tests on each valuation ratio to determine how reliable it is for a given stock. Ratios that produce noisy or unpredictable signals get filtered out. Only the ones that are trustworthy for that specific company make the cut.
This is why META uses P/FCF while Amazon uses P/OCF and JPMorgan uses P/E. If a company's growth profile changes over time, the selected ratios may change with it.
Why not just use P/E ratio?
P/E is one of dozens of valuation ratios, and it's not reliable for every company. Companies with volatile or negative earnings make P/E meaningless. REITs need P/FFO, banks need P/B, and high-growth companies need growth-adjusted multiples like P/FCF-to-Revenue-Growth. Our model figures out which ratios and growth adjustments are trustworthy for each stock automatically, so you don't have to.
What does a score of 1 vs 5 mean?
A score of 5 means the stock appears deeply undervalued based on its reliable valuation multiples compared to historical averages and expected growth. A score of 1 means it appears deeply overvalued. A 3 means it looks fairly priced. These aren't buy or sell signals. They're a data point to help you understand whether the current price seems reasonable for that company.
How far back does the valuation data go?
Depending on your subscription tier, you can see how the Valuation Score rated any stock at any point over up to 35 years of history. Every historical score uses only data that was available at that moment, with no hindsight bias.
How often does the Valuation Score update?
The Valuation Score updates throughout the trading day as stock prices move. Since valuation ratios are directly tied to price, every price change can shift the score. Growth estimates and financial data are also refreshed as new information becomes available, so growth-adjusted signals stay current too.
Is the Valuation Score available for all stocks?
We score over 100,000 stocks across 70+ global exchanges. Not every security gets a valuation rating, as some don't have enough reliable financial data. The model only produces a rating when it has enough trustworthy data to be meaningful.
How is this different from other valuation tools?
Most valuation tools apply the same ratios to every stock, or let you pick manually. Ours algorithmically selects which ratios to trust for each company, then layers in growth-adjusted metrics so a stock trading at a high P/FCF but growing rapidly can still score well. It evaluates P/E, P/S, P/FCF, P/EBITDA, P/OCF, yield metrics, risk premiums, and growth-to-price ratios. The combination of per-stock metric selection, growth adjustment, and multi-signal analysis is something we haven't seen anywhere else.
Still have questions?