Stock Scores That
Actually Work
7 score categories that assess every angle of a stock. Led by a Valuation Score that identifies cheap and expensive stocks using per-stock metric selection. Built for precision.
See GOOG's Live Score


Jan 20, 2026 snapshot · Click any ticker for live scores
Purely Fundamental
No technical analysis, no momentum. A stock going up doesn't make it score higher. We analyze the business, not the ticker.
Customized Per-Stock
Our Valuation Score selects the most reliable valuation metrics for each company individually, not just by industry template.
Up to 35 Years of Backtesting
See how any stock scored at any point in history. Point-in-time accurate, no hindsight bias. Explore historical scores.
Where the Obsession Started
In 2020, our co-founder Daniel was spending hours analyzing stocks by hand, running through the same checklist for every company on his YouTube channel with 260K+ subscribers. He wanted a score that thinks like a value investor. So we built one.
The Manual Grind
- Hours in Excel spreadsheets
- Digging through 10-Ks manually
- Inconsistent ratio calculations
Instant Clarity
- 80+ metrics analyzed instantly
- Consistent across ~100,000 stocks
- Industry-calibrated, repeatable logic
What started as hand-written notes became a 5-year engineering challenge, complete with all-nighters, technical breakthroughs, and an algorithm that now customizes itself for every single stock.
Read the full storyEvery Industry is Different
Most sites apply one formula to every stock. Our Fundamental Score adapts by industry and company type, while the Valuation Score selects metrics individually for each stock. A bank and a tech company are never evaluated the same way.

NVIDIA
Semiconductors

JPMorgan
Diversified Banks
Calibrated across ~100,000 stocks on 70+ global exchanges
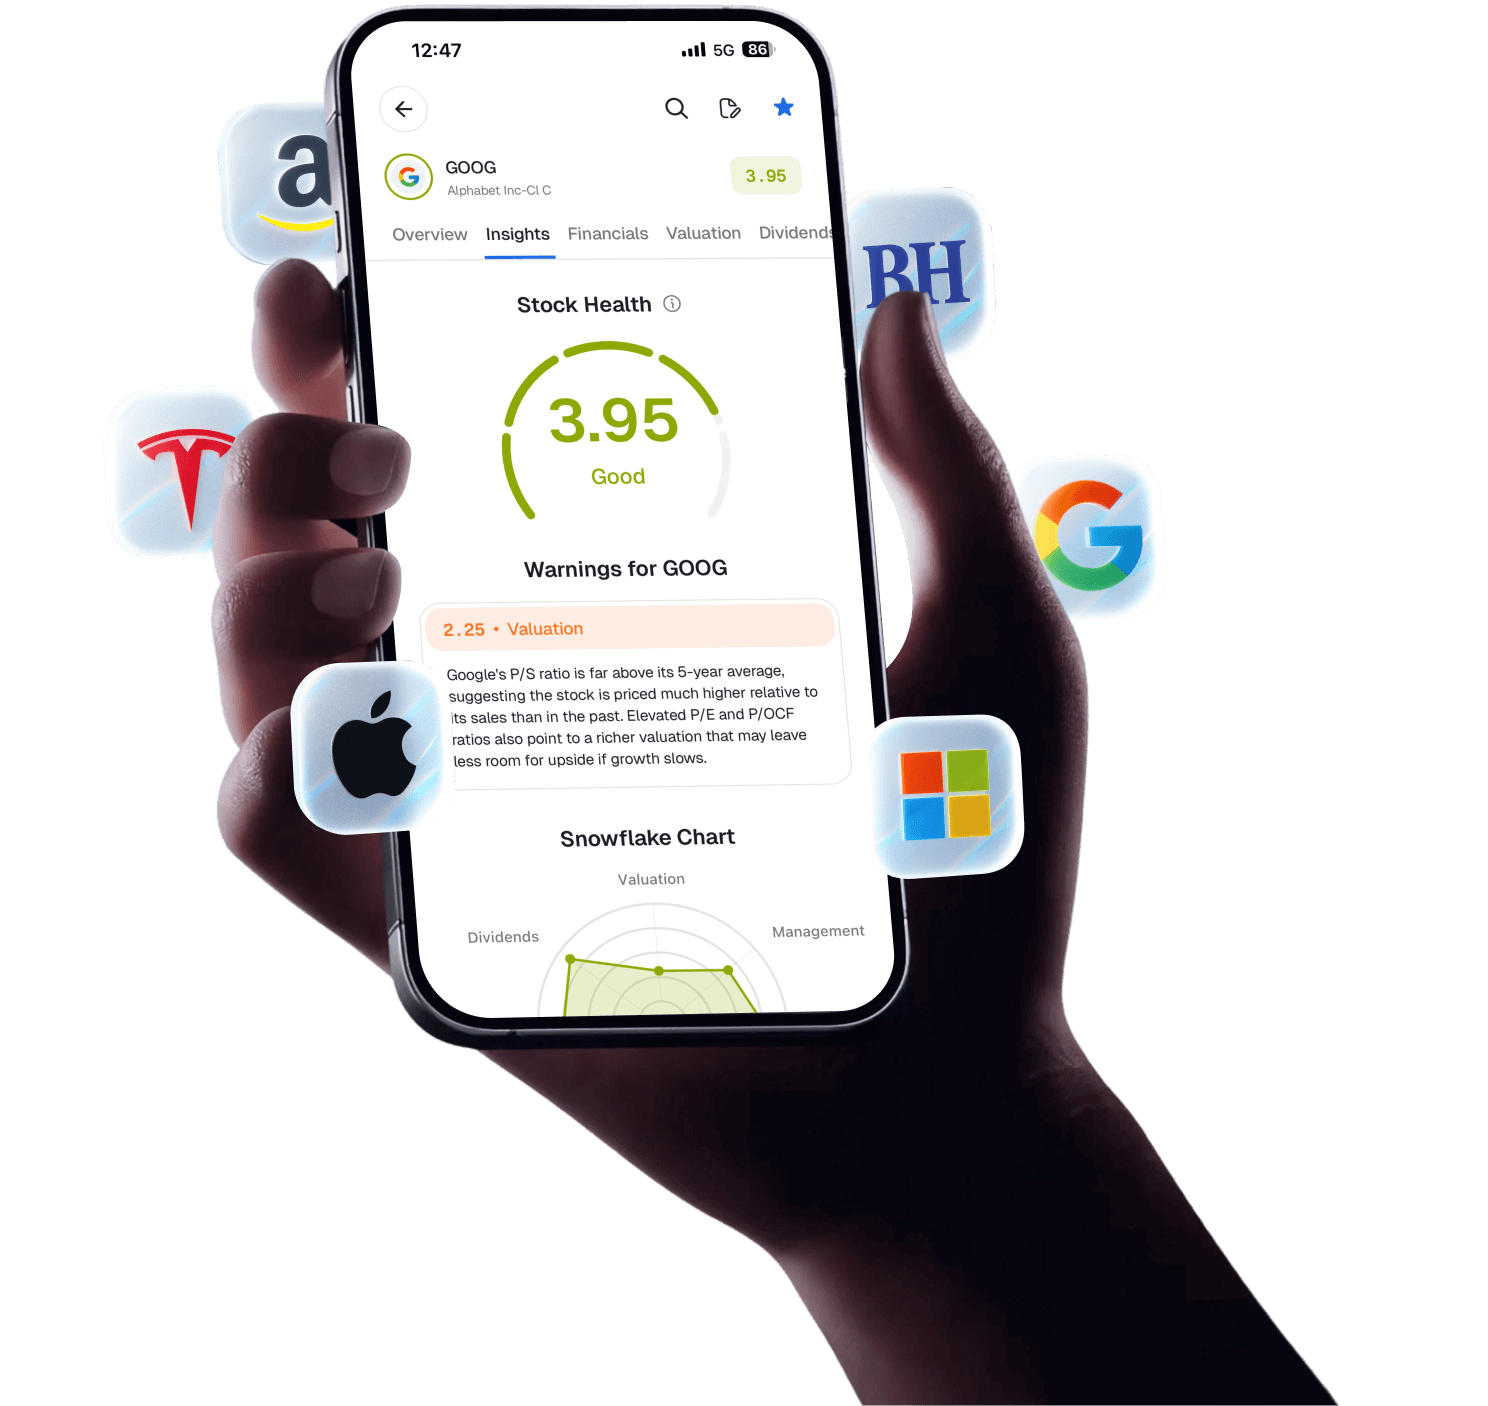
Making an Informed
Stock Decision Is Hard
Every Stock Score combines two components: a Valuation Score that identifies cheap and expensive stocks, and a Fundamental Score that measures business quality across 6 categories. 80+ metrics, one clear 1-5 score.

Fundamental Score
6 categories of business quality: Profitability, Growth, Financial Health, Dividends, Management, and Analyst consensus.
Valuation Score
Per-stock metric selection identifies cheap and expensive stocks in real time. The most unique component of every Stock Score.
Learn more →What Do The Scores Mean?
Green means strong. Red means dig deeper.
Excellent Fundamentals
Top-tier profile. Strong scores across all 7 categories, including the Valuation Score.
Healthy Profile
High-quality business. Strong scores in most areas with few fundamental weaknesses.
Mixed Signals
Conflicting metrics (e.g., High Growth but Expensive, or Cheap but Low Profitability).
Caution Advised
Below-average fundamentals. Multiple red flags likely outweigh the business strengths.
High Risk
Fails nearly all fundamental checks. Historically associated with poor capital preservation.
Example
If AAPL's overall score is 3.9, that means its fundamentals are Good
The score is a snapshot of fundamental health, not a predictor of future stock price movement. It is designed to illuminate financial strength, but investors should perform their own due diligence
Stock Scores for Every Investor
Whether you're just starting out or managing millions, Stock Scores meets you where you are
For Beginners
Simple 1-5 scores help you understand any stock and learn the why behind the number
For Intermediate
You've done the research; we surface the warnings and risks you might've overlooked
For Experts
Sanity-check any stock instantly, or screen thousands to find what's worth your time
Stock Scores for Every Industry
Every company is unique. Our algorithm adjusts to each business model, so companies are evaluated on what actually matters


Jan 20, 2026 snapshot · Click any ticker for live scores
See How Any Stock Really Performed
Powered by up to 35 years of point-in-time Stock Scores. See exactly what you would have seen at any moment in history.
Point-in-Time Accuracy
Scores calculated using only data available at that moment
Up to 35 Years of History
Deep historical data for meaningful backtesting
No Look-Ahead Bias
Test strategies without hindsight contamination
Common Questions About Stock Scores
Everything you need to know about how Stock Scores work
What are Stock Scores?
Stock Scores are a 1-to-5 rating system built on pure fundamentals. Each score combines two components: a Valuation Score that identifies cheap and expensive stocks using per-stock metric selection, and a Fundamental Score that measures business quality across 6 categories (Profitability, Growth, Financial Health, Dividends, Management, and Analyst). All 7 categories are equally weighted and calibrated per industry, sometimes per stock.
No technical analysis, no momentum. A stock going up doesn't make it score higher. We analyze the business, not the ticker.
What makes Stock Scores different from other rating systems?
Most scoring tools apply the same template to every stock. Some factor in technical analysis and price momentum, so a stock going up scores higher simply because it's going up. That's the opposite of what a fundamental score should do.
Stock Scores are purely fundamental. Our algorithms are calibrated per industry and sometimes per stock. The Valuation Score goes even further: it algorithmically selects the most statistically reliable valuation multiples for each individual company, evaluating whether it appears over or undervalued relative to its own price history and expected growth. No one else does this.
Do Stock Scores actually work?
Thousands of customers across 100+ countries use Stock Scores as part of their investing process. Scores are for informational and educational purposes, not buy or sell recommendations. They help beginners know where to start and save experienced investors hours of research across tens of thousands of stocks.
You can judge for yourself: we provide up to 35 years of historical score data so you can see how any stock scored at any point in history and decide whether the patterns are meaningful to you. Past performance does not guarantee future results.
Can a high-scoring stock still lose money?
Yes, and that's investing. Scores measure fundamental health and valuation today. They can't predict lawsuits, executive scandals, fraud, or sudden macro shifts. A stock can score a 5 and still drop if something unexpected happens.
Stock Scores are one tool in your toolkit, not the whole toolkit. They're designed to inform your decisions, not make them for you. Always do your own research and consider your personal financial situation before investing.
What is the Valuation Score?
The Valuation Score is one of the 7 score categories and the most unique. It algorithmically selects the most statistically reliable valuation multiples for each specific company, then evaluates whether it appears over or undervalued relative to its own price history and expected growth. A fast-growing tech company and a mature dividend payer are not valued the same way.
Valuation Scores update in real time throughout the trading day as prices move. If growth characteristics change, the selected metrics change with them.
How often are scores updated?
All scores update throughout the day. Price-sensitive metrics like valuation multiples and dividend yield reflect current stock prices in real time. Other metrics update when companies report new financial data, earnings, or dividends. You'll always see the most current assessment when you load a stock's page.
Can I use Stock Scores for international stocks?
Yes. We score over 100,000 stocks across 70+ global exchanges. Whether you're looking at US blue chips, Canadian banks, European industrials, or Asian tech companies, our scoring algorithms are calibrated for each market and industry.
How can I find stocks using scores?
Our Stock Screener lets you filter by any score combination. You can search for undervalued dividend stocks, high-growth companies with strong financials, or any custom criteria you care about. It's one of the most popular features on the platform.
Is Stock Scores free?
You can see scores for a selection of stocks on our free plan. Pro and Unlimited subscribers get full access to scores for all 100,000+ stocks, plus up to 35 years of historical score data. We offer a 30-day money-back guarantee on all first-time purchases, no questions asked.
Still have questions?