Quickly see if a stock is
actually worth buying
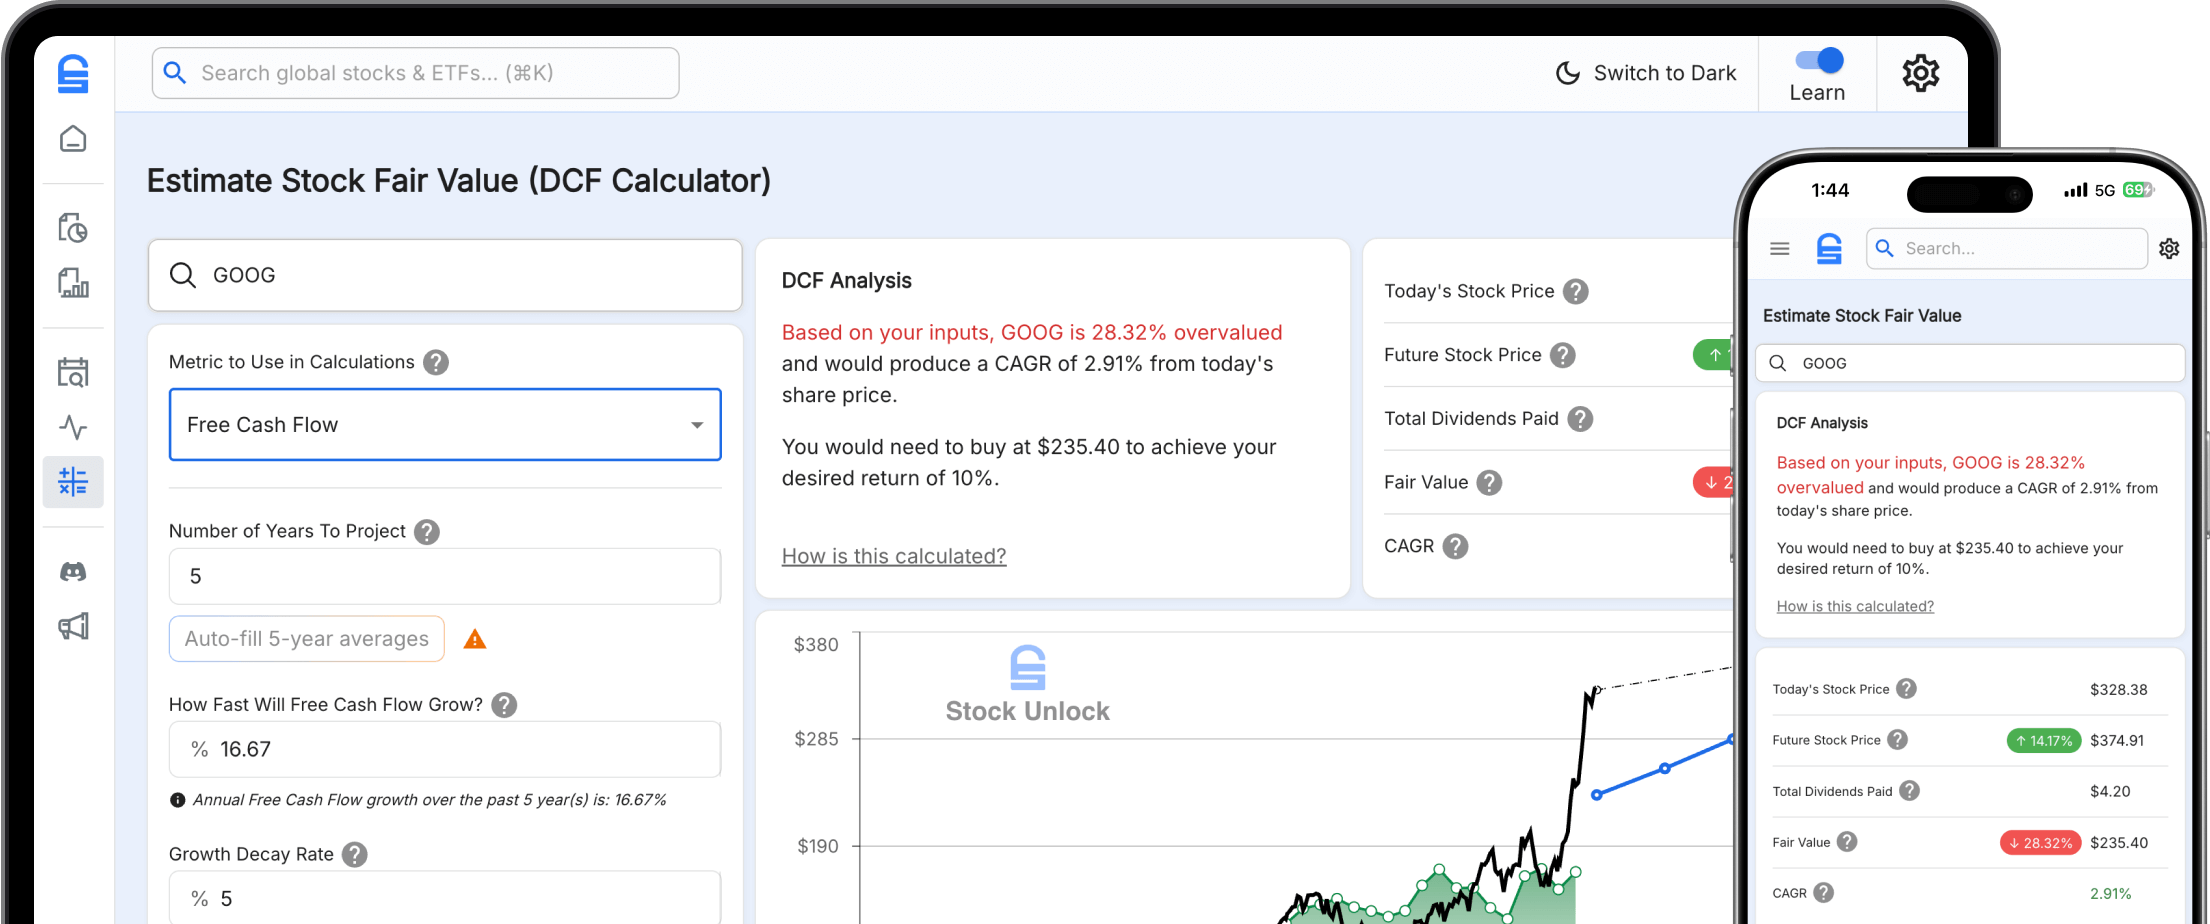
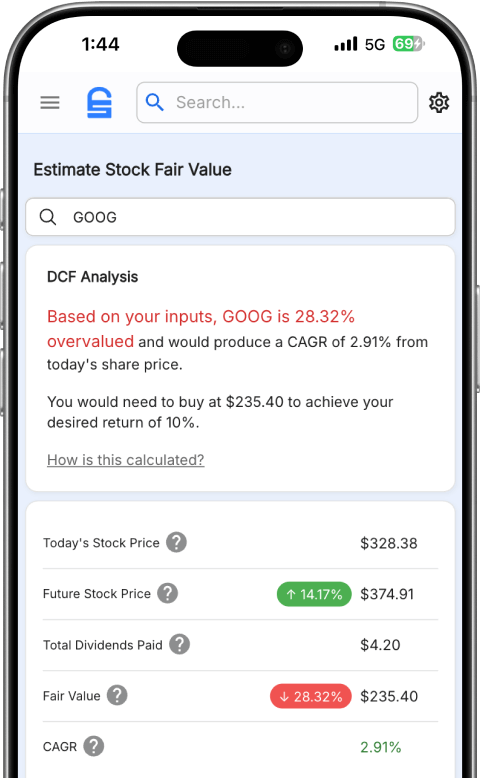
Estimate what a stock is worth with our fair value calculator. We pre-fill the latest financials. You adjust the assumptions.
We pre-fill the data · You customize the assumptions · Fair value in seconds
You're In The Driver's Seat
Adjust growth rates, margins, and discount rates to match your assumptions. Fine-tune every input to build the perfect valuation score.
- Calculate using FCF, Net Income, EBITDA, and more
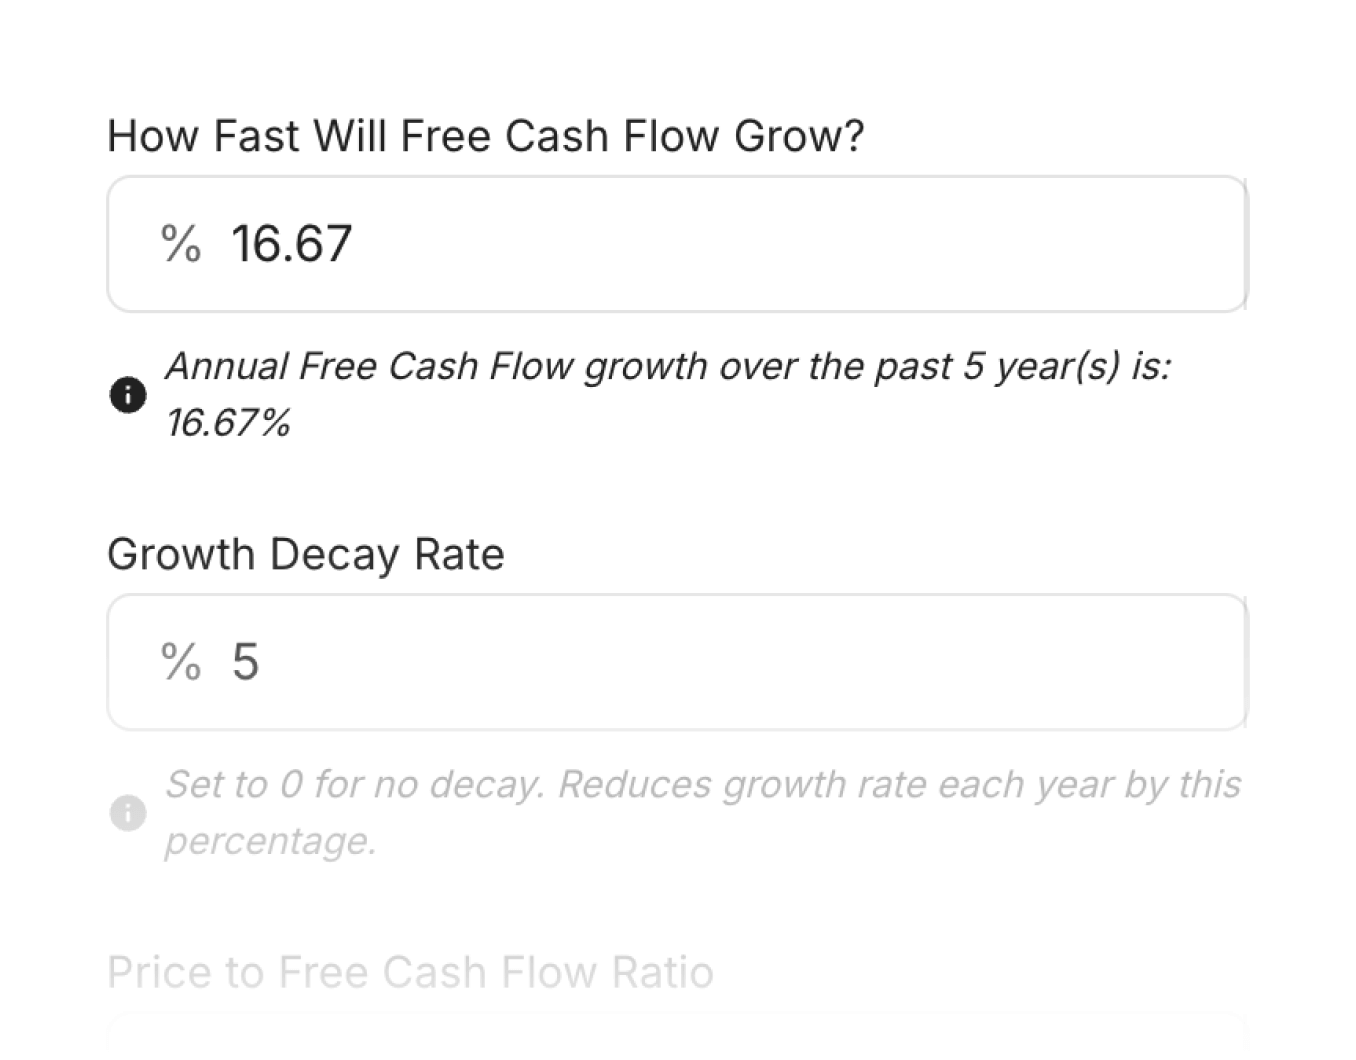
- Control growth, decay rates, and terminal multiples
Price vs. Value, Visualized Instantly
Pre-filled with up to 35 years of historical data. Project 1-10 years forward. Just type a ticker and instantly find out if a stock is over or undervalued.
Start Valuing Stocks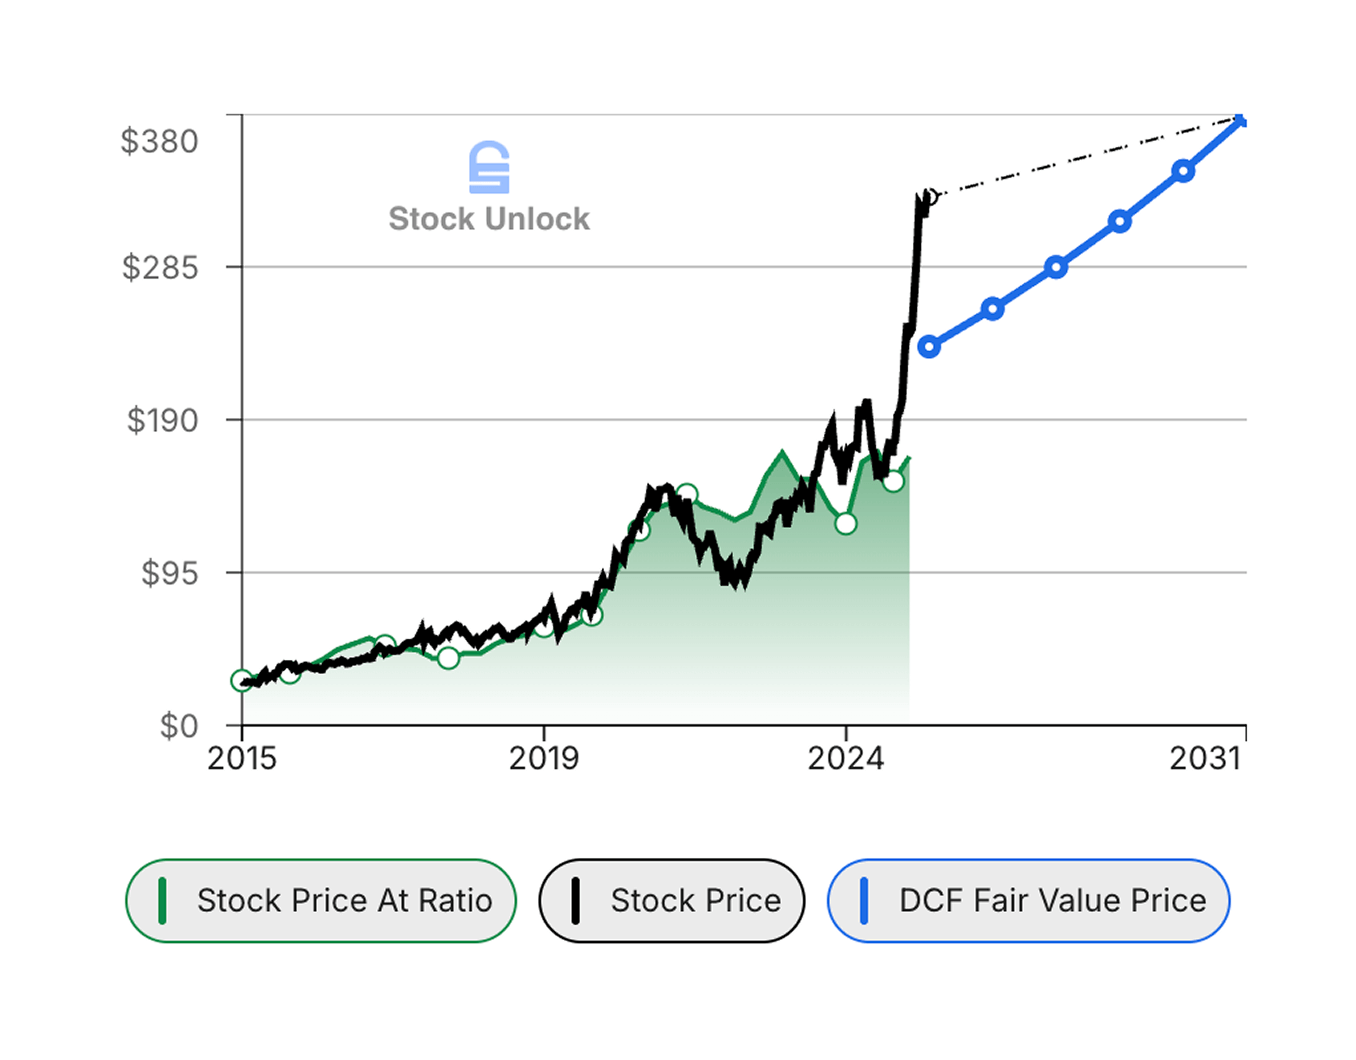
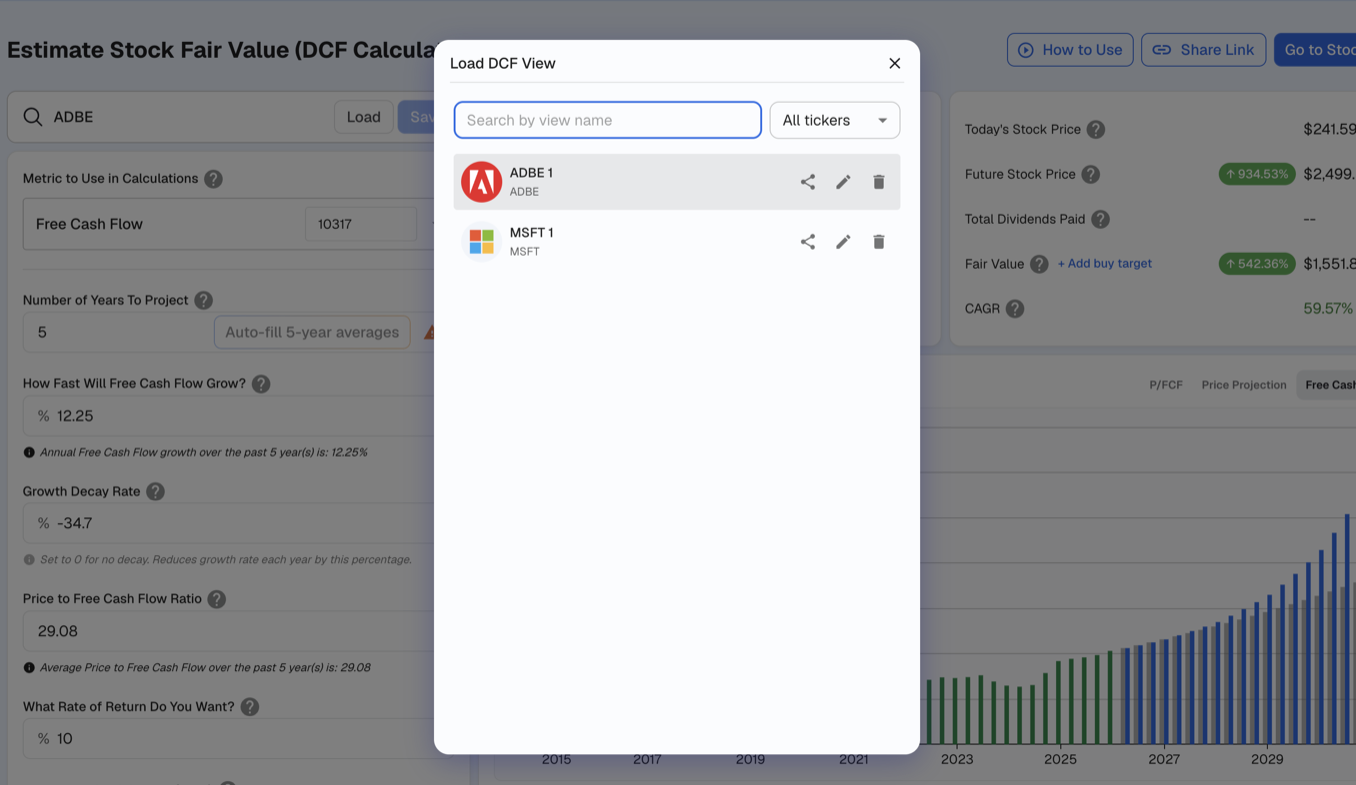
Save & Load Your DCF
Hit Save next to any ticker to name and store your current inputs. Load them back anytime so you can revisit valuations, compare scenarios, and build long-term investing workflows.
- Save DCF calculations with every input preserved
- Load saved DCF calculations with one click from the calculator
- Included with Pro and Unlimited plans
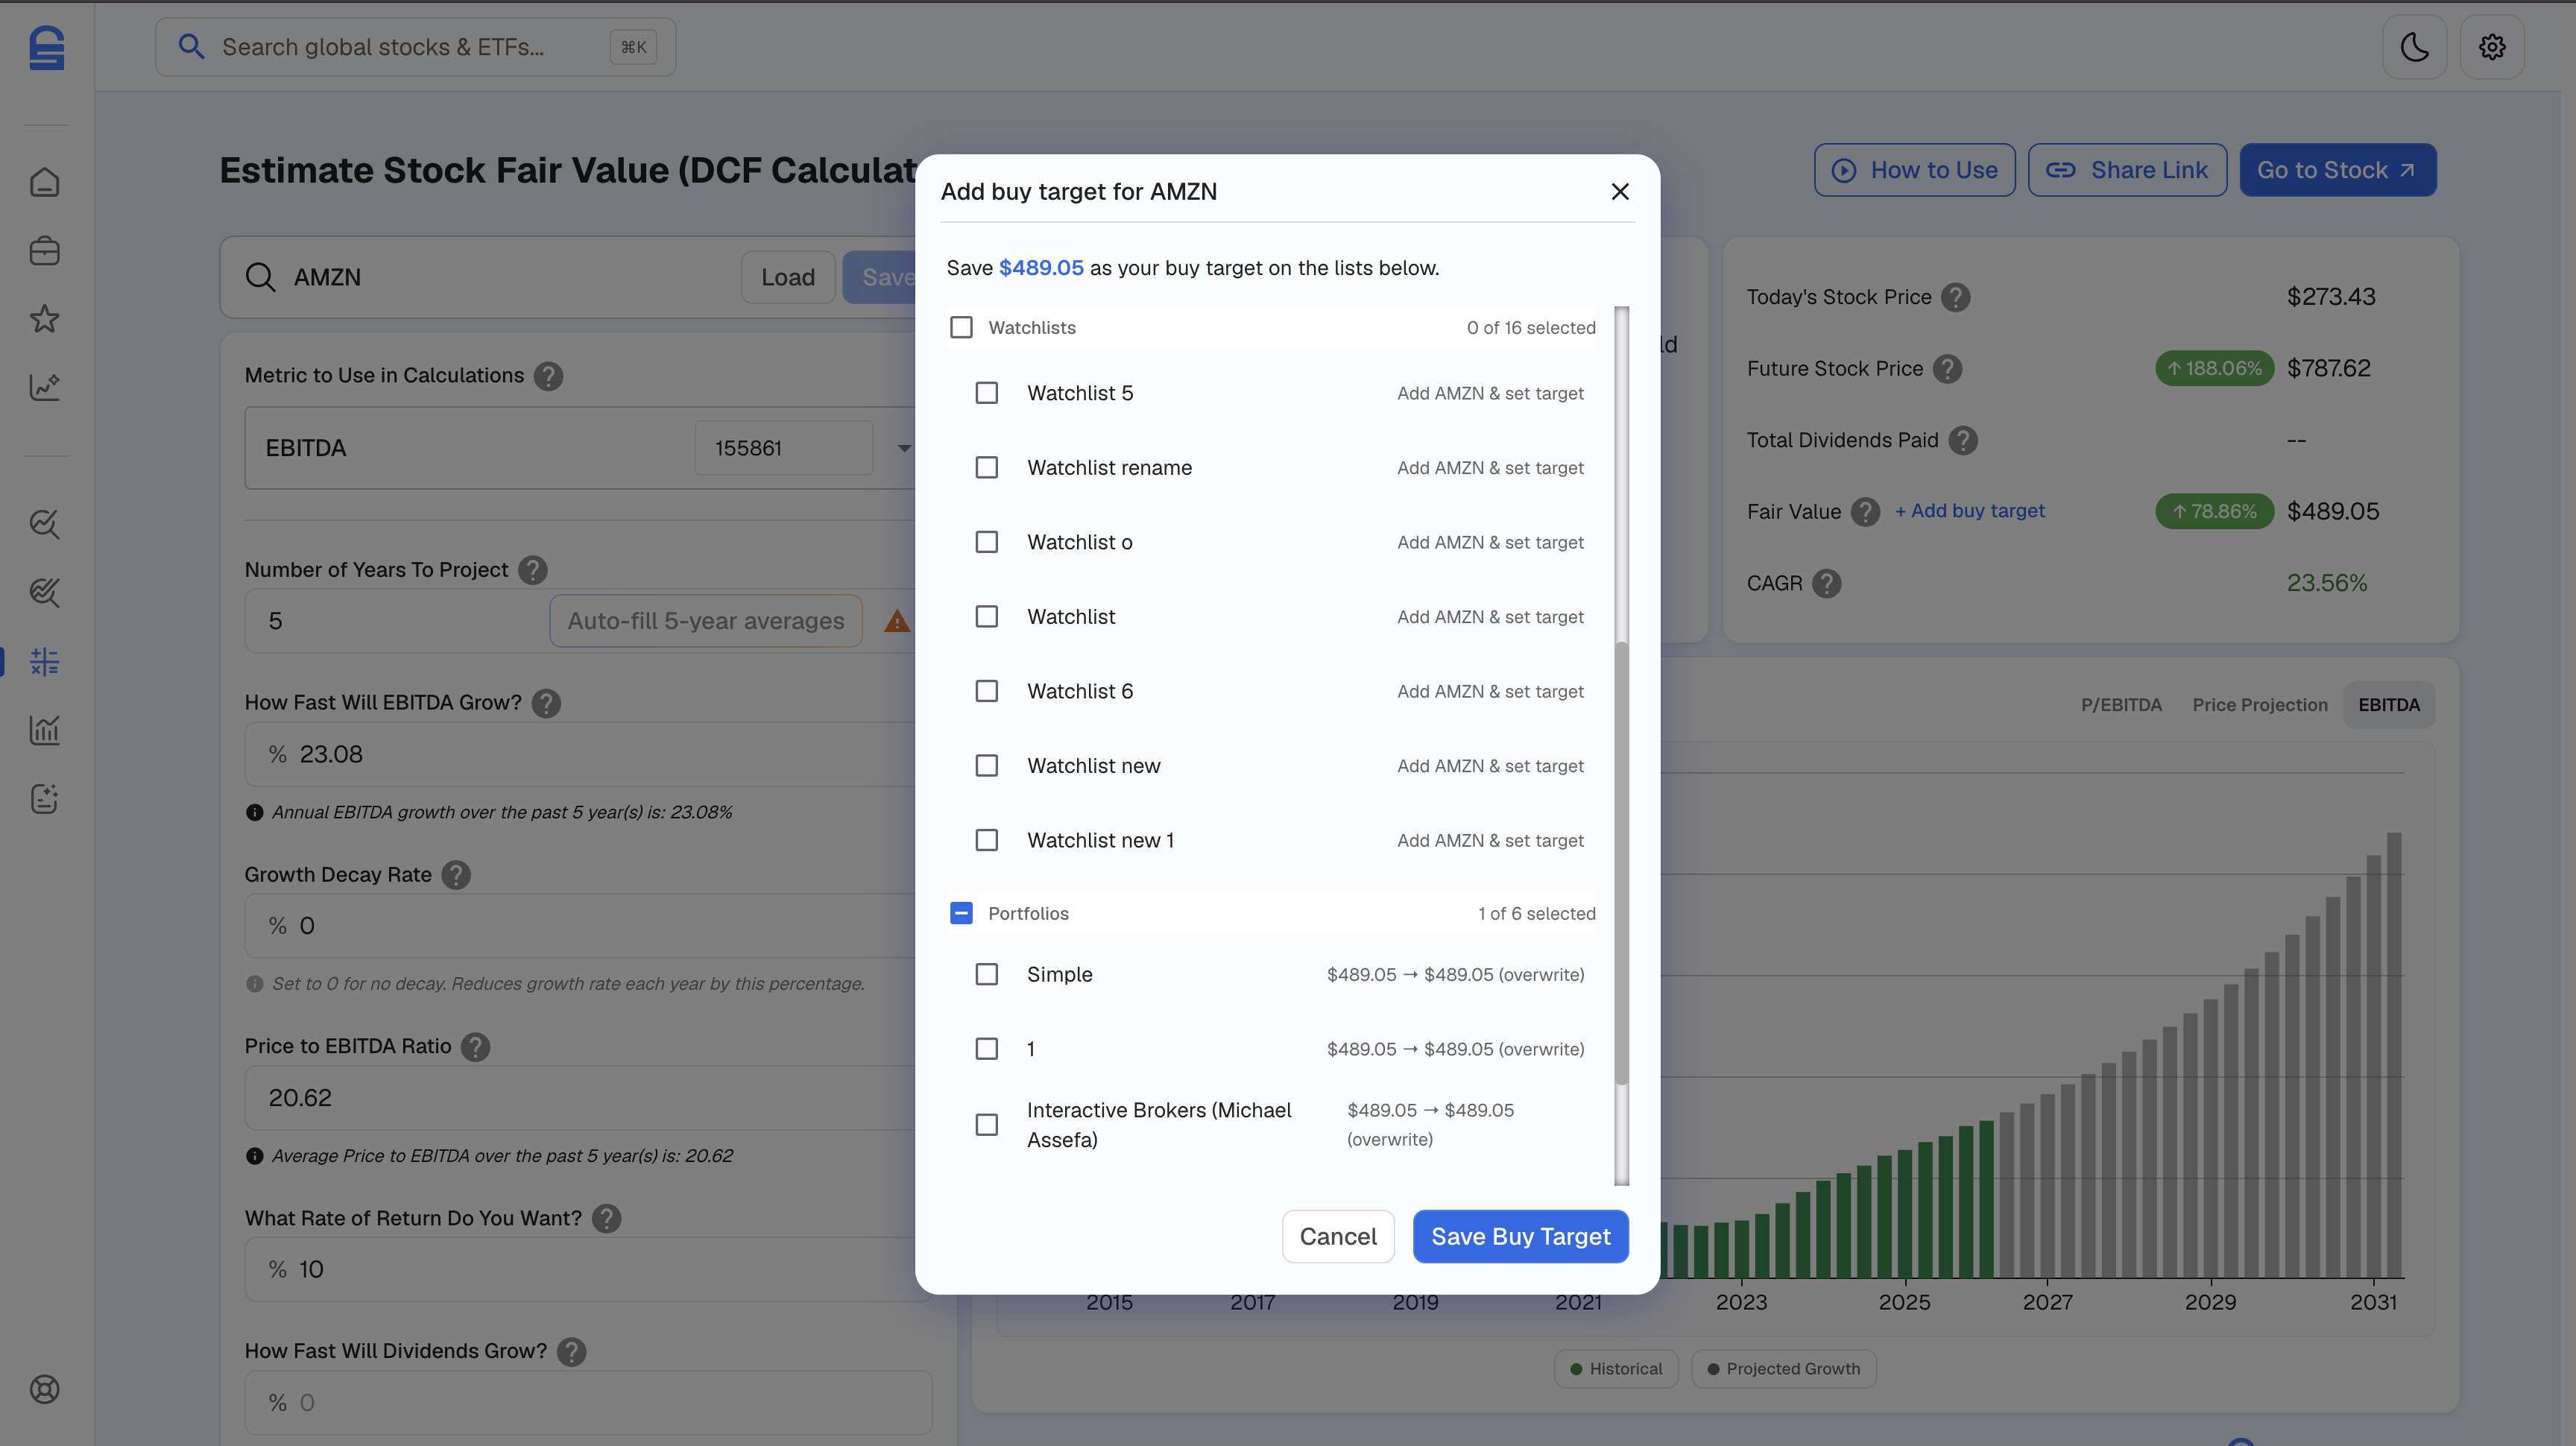
Turn Fair Value Into Action
Set buy targets on watchlists and portfolio positions straight from the DCF page. Your watchlist and portfolio tables show the target with a link back to the DCF calculation that produced it.
- Add buy targets to multiple watchlists at once
- Set targets on portfolio positions you already hold
- Click back to reopen the linked DCF calculation
How It Works
Search Ticker
Enter any stock ticker to load years of financials automatically.
Adjust Assumptions
Review growth rates and margins. Tweak them to match your view.
See Fair Value
Instantly see the intrinsic value and margin of safety.
Save Your Calculation
Name and save your DCF inputs. Load them back anytime (Pro & Unlimited).
Set Buy Targets
Push fair value to watchlists and portfolios, linked back to your DCF calculation.
Stop Wasting Time in Spreadsheets
Why build it yourself when we've already done the hard work?
- Finding historical data manually
- Broken formulas & #REF errors
- Outdated as soon as earnings release
- Hours to build one model
- Up to 35 years data, project 1-10 years
- Error-free, vetted formulas
- Updates automatically every day
- Valuations in seconds
DCF Calculator FAQ
Everything you need to know about Discounted Cash Flow analysis
What is DCF analysis and why does it matter?
DCF (Discounted Cash Flow) analysis is a valuation method that estimates the intrinsic value of a stock based on its expected future cash flows. The core idea is simple: a company is worth the sum of all the money it will generate in the future, discounted back to today's dollars.
This matters because stock prices fluctuate based on market sentiment, but intrinsic value is based on fundamentals. By comparing a stock's current price to its DCF fair value, you can identify whether it's potentially undervalued (a buying opportunity) or overvalued (a sell signal). Warren Buffett and many professional investors use DCF as a cornerstone of their investment process.
How does Stock Unlock's DCF Calculator work?
Just type any stock ticker and our calculator automatically loads years of historical financial data. No spreadsheets, no manual data entry. The calculator pre-fills growth rates based on actual historical performance, so you start with realistic assumptions rather than guessing.
The calculation follows a 5-step process: (1) Project your chosen financial metric forward using your growth assumptions, (2) Account for share count changes (buybacks or dilution), (3) Calculate future stock price using a terminal multiple, (4) Add projected dividends if applicable, and (5) Discount everything back to present value. You can click "How is this calculated?" to see the exact math with your numbers.
What financial metrics can I use for DCF analysis?
Stock Unlock supports 7 different valuation metrics to fit different company types and analysis preferences:
- Free Cash Flow (FCF) - Best for most mature companies. Shows actual cash available after capital expenditures.
- Operating Cash Flow (OCF) - Broader view of cash generation before capex.
- Net Income / Earnings - Classic profitability-based valuation.
- Operating Income - Focuses on core operational performance.
- EBIT - Earnings before interest and taxes, useful for comparing companies with different capital structures.
- EBITDA - Popular for capital-intensive industries where depreciation varies widely.
- Book Value - Asset-based valuation, particularly useful for banks and financial companies.
How many years can I project forward?
You can project anywhere from 1 to 10 years forward. The default is 5 years, which works well for most analyses, but you have full control to adjust based on your investment horizon and the company's predictability.
Keep in mind that longer projections involve more uncertainty. A 1-3 year projection might be appropriate for a rapidly changing tech company, while a 7-10 year projection might suit a stable utility or consumer staples company with predictable cash flows. Our Growth Decay feature helps model the reality that high growth rates typically slow over time.
What discount rate should I use?
The discount rate represents your required annual return. We default to 10%, which approximates the long-term average stock market return and serves as a reasonable hurdle rate for most investors.
You might use a higher discount rate (12-15%) for riskier, volatile stocks where you demand higher returns to compensate for uncertainty. For stable, blue-chip dividend stocks, a lower rate (8-10%) might be appropriate. Some investors use their personal required return, while others use a company's weighted average cost of capital (WACC). There's no single "correct" answer, which is why we let you adjust it.
How accurate is DCF analysis?
DCF is a powerful framework, but it's only as accurate as your assumptions. The output is highly sensitive to growth rate and discount rate inputs. A small change in assumptions can significantly change the calculated fair value. That's a feature, not a bug. It forces you to think critically about what you actually believe will happen.
We recommend using DCF as one tool among several, not as a crystal ball. It works best for companies with predictable cash flows and less well for early-stage companies, cyclical businesses, or turnaround situations. Running multiple scenarios with different assumptions (bull case, bear case, base case) gives you a range of values rather than false precision.
Is the DCF Calculator free to use?
Yes! You can use the DCF Calculator completely free without creating an account. Free users get 3 valuations per week on any stock. Featured stocks like AAPL, GOOG, NVDA, and JPM have unlimited free access so you can explore the tool fully.
Paid Pro and Unlimited plans unlock unlimited valuations, deeper historical data (up to 35 years), saved DCF calculations, buy targets on watchlists and portfolios, portfolio tracking with brokerage sync, advanced Stock Scores, and more. All paid plans include a 30-day money-back guarantee.
What makes Stock Unlock's DCF Calculator different from others?
We built the easiest-to-use DCF calculator with the most optionality. While most tools offer 1-2 valuation metrics, we give you 7, plus Growth Decay modeling for realistic long-term projections that account for how growth naturally slows over time. No manual data entry: we automatically load historical financials for 170,000+ stocks and ETFs across 70+ global exchanges.
Unlike standalone calculators, Stock Unlock connects DCF to your investing workflow. Save DCF calculations, set buy targets on watchlists and portfolio positions, and jump back to the DCF calculation from your table. The calculator is part of a larger ecosystem (Stock Scores, screeners, dividend analysis, portfolio tracking), and most tools are free to try without creating an account.
Can I save my DCF calculations?
Yes. Pro and Unlimited subscribers can save DCF calculations with every input preserved: growth rate, discount rate, valuation metric, projection years, and more. Use Save and Load in the calculator to pick up where you left off instead of re-entering assumptions from scratch.
This makes it easier to revisit valuations, compare scenarios across stocks, and build long-term investing workflows. You can also share a link that opens the exact saved DCF calculation.
Can I set a buy target from the DCF Calculator?
Yes. Pro and Unlimited subscribers can save a DCF fair value as a buy target on watchlists and portfolio positions directly from the calculator. Select multiple watchlists and portfolios at once. On watchlists, you can add the ticker and set the target in the same step, or overwrite an existing target. Portfolios apply to positions you already hold.
When linked to a saved DCF calculation, your watchlist and portfolio tables show a DCF icon next to the buy target. Click it to reopen the same assumptions in a new tab. This is a personal buy target based on your DCF work, not an analyst price target.
Still have questions?