Find Better Stocks.
Track Your Portfolio.
170,000+ Global Stocks & ETFs, 35 Years
of Financials & Dividends Data


Trusted by 100,000+ investors worldwide
Stock Scores That Actually Work
Unique to every stock, validated against real market data, and refined over years


Jan 20, 2026 snapshot · Click any ticker for live scores


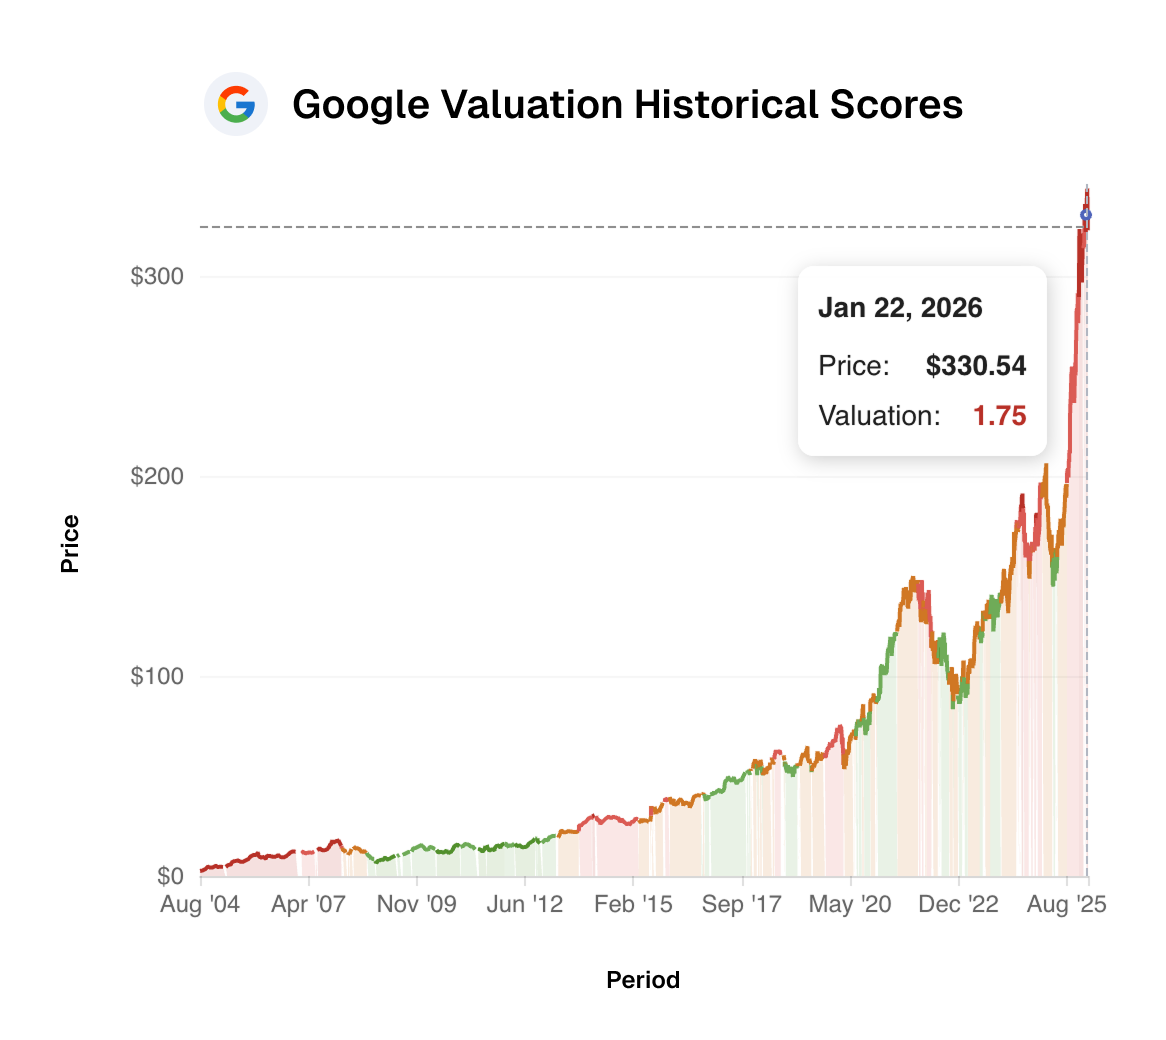
See If Any Stock Is
Cheap or Expensive
Our Valuation Score selects the most reliable valuation ratios for each stock, compares them against history and growth, then rates it 1-5
Trusted by 100,000+ Investors Worldwide
"I stopped my subscription of Simply Wall Street because I didn't need it anymore. Now I don't know what I would do without Stock Unlock."
Sophie
"This is the kind of info you get in HIGH $$$$ priced newsletter subscriptions. I feel guilty getting your info so cheap!"
Derek
"I'm 71 and have been investing for about 50 years. I have used many advisory services over the decades. Yours is simply one of the best!"
Kris
Backed By
Powered By
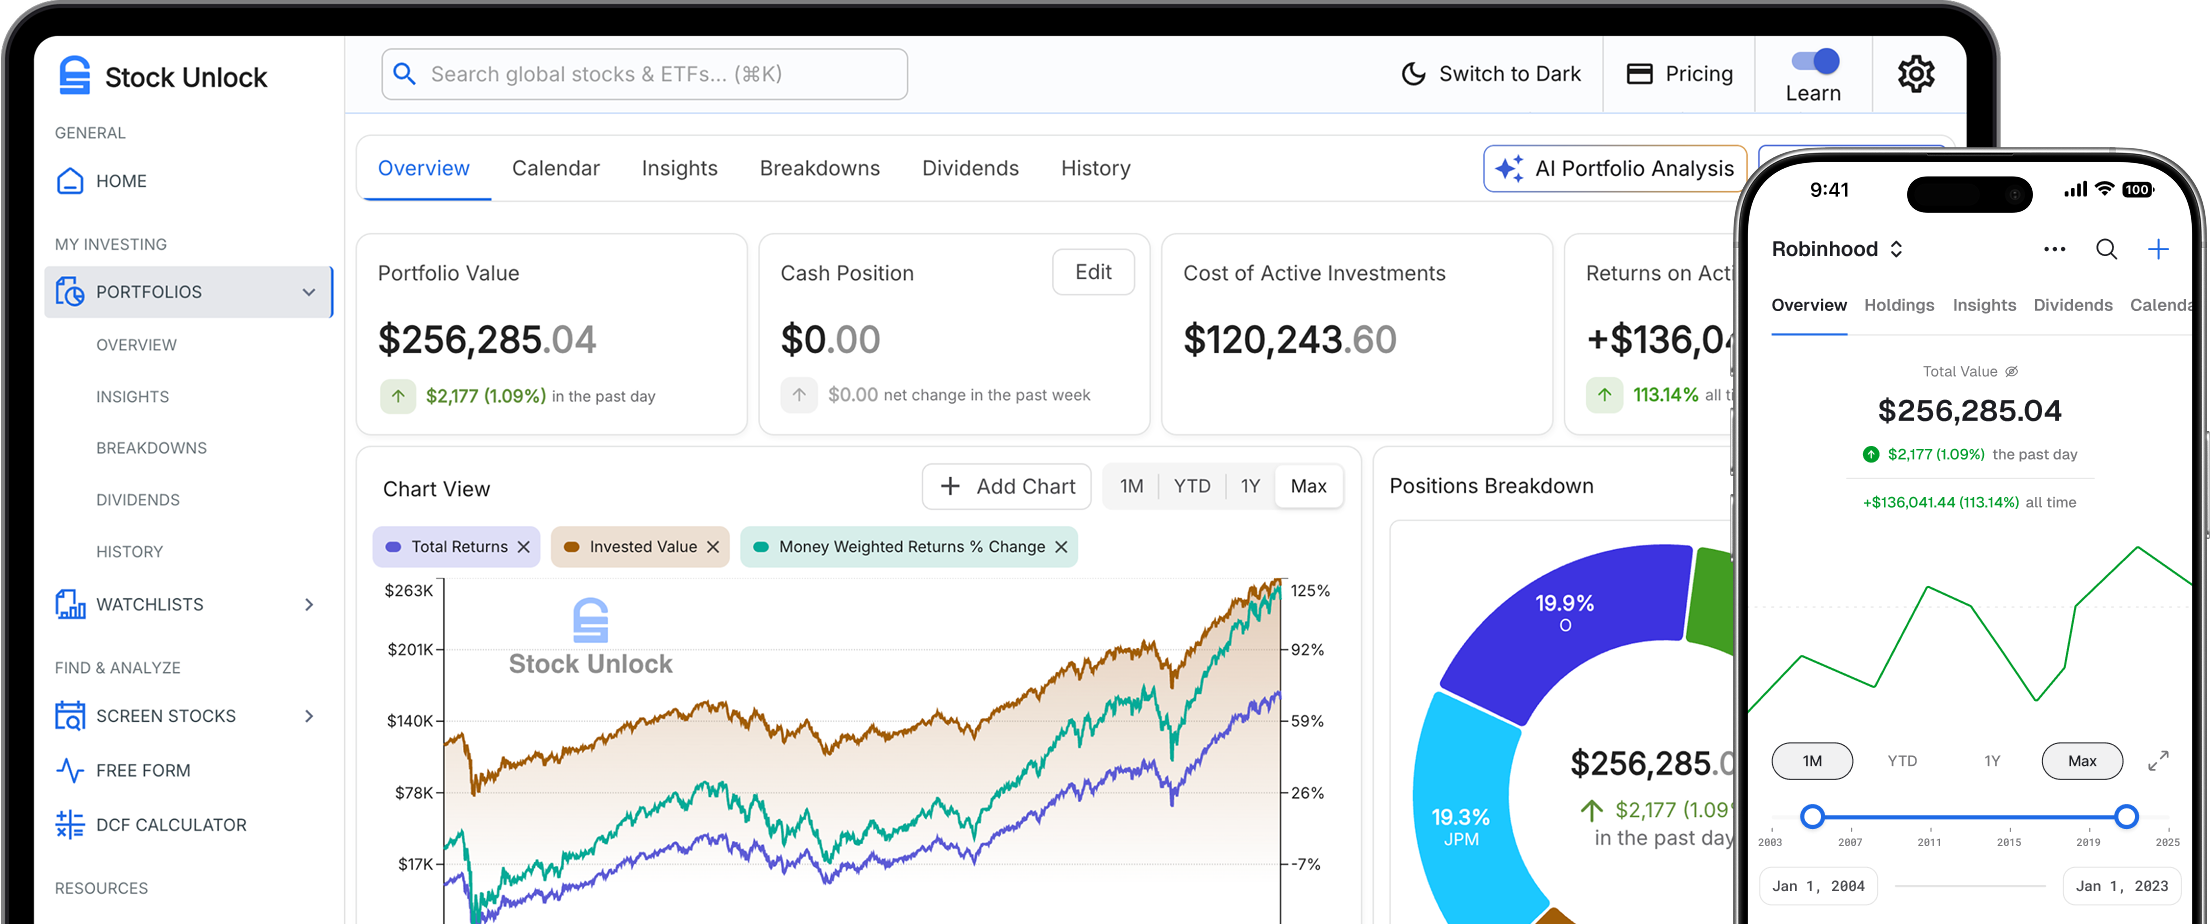
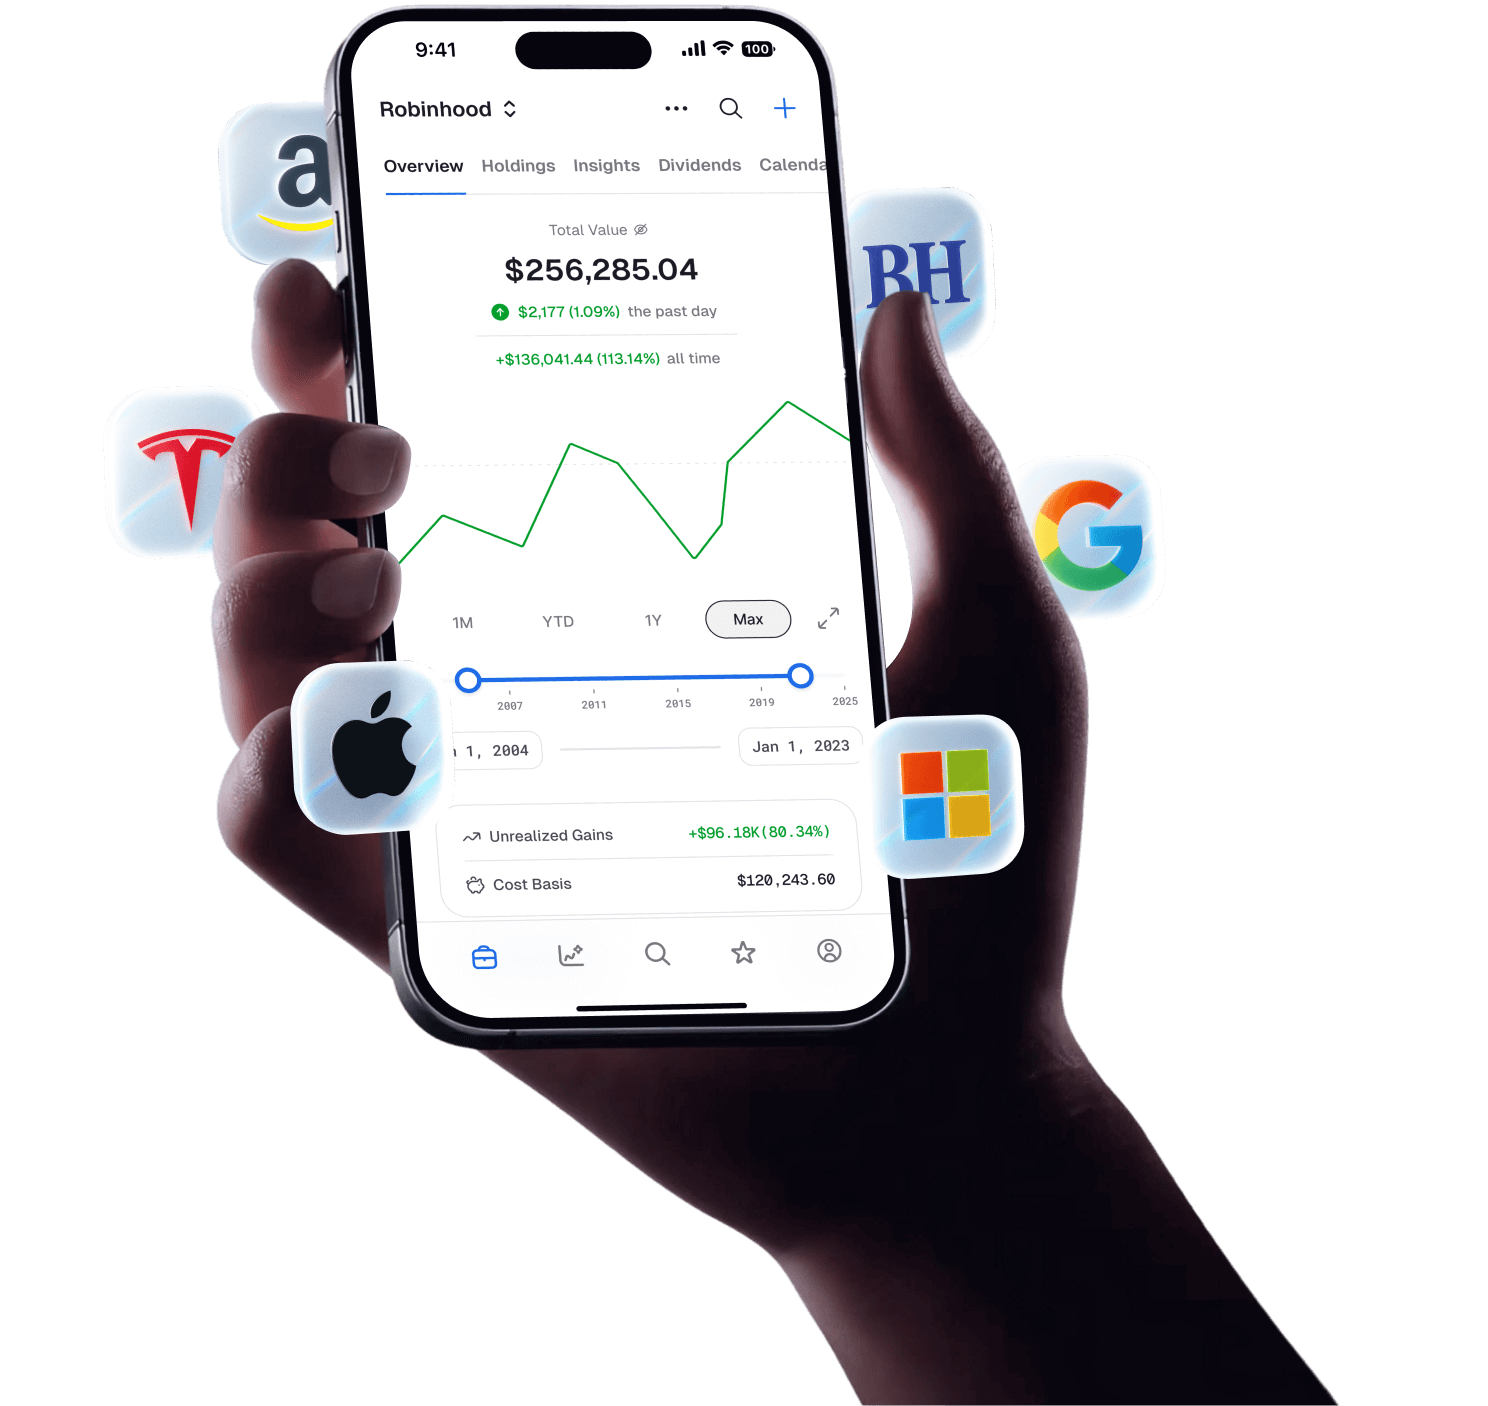
The Portfolio Tracker
Your Broker Should Have Built
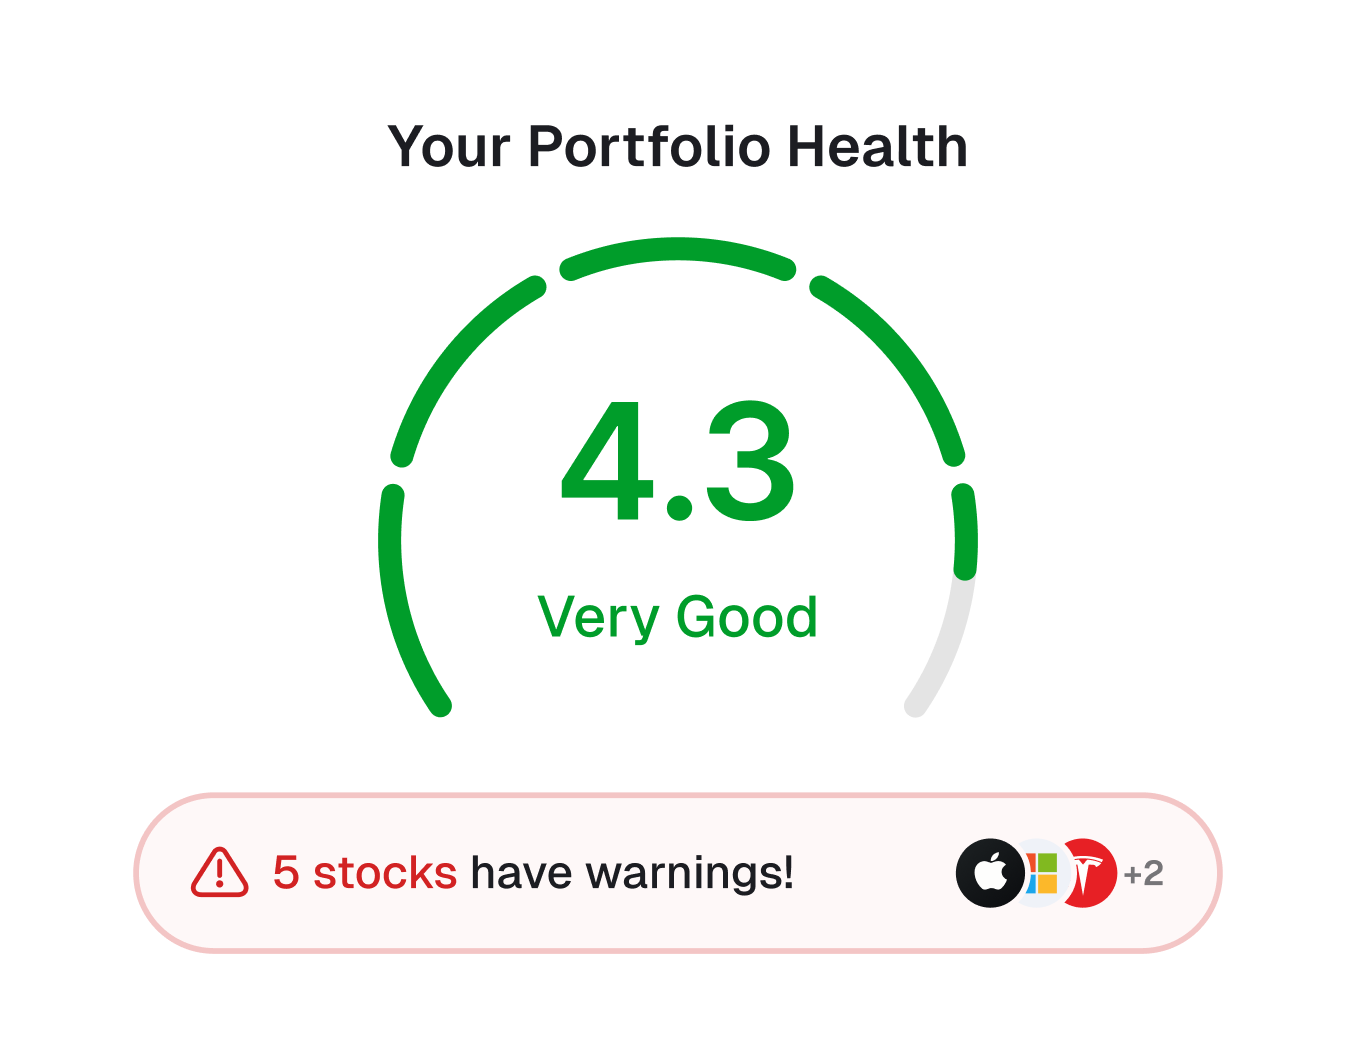
Brokerages profit when you trade. We profit when you invest smarter. See your real returns, forecast dividend income, spot weak holdings, and sync 30+ brokerages globally.
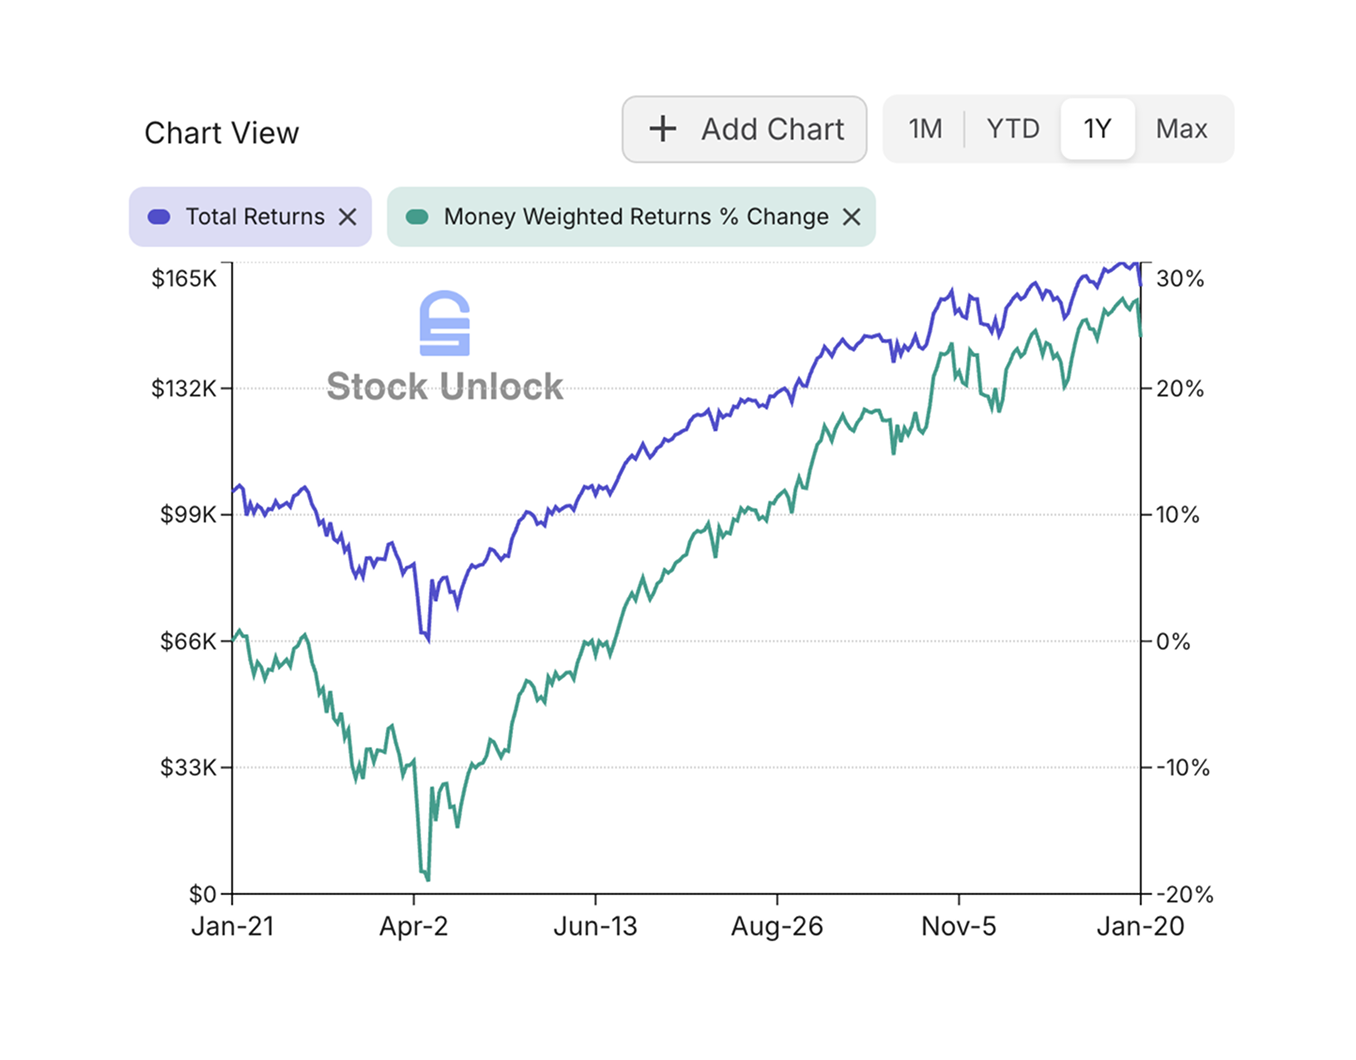
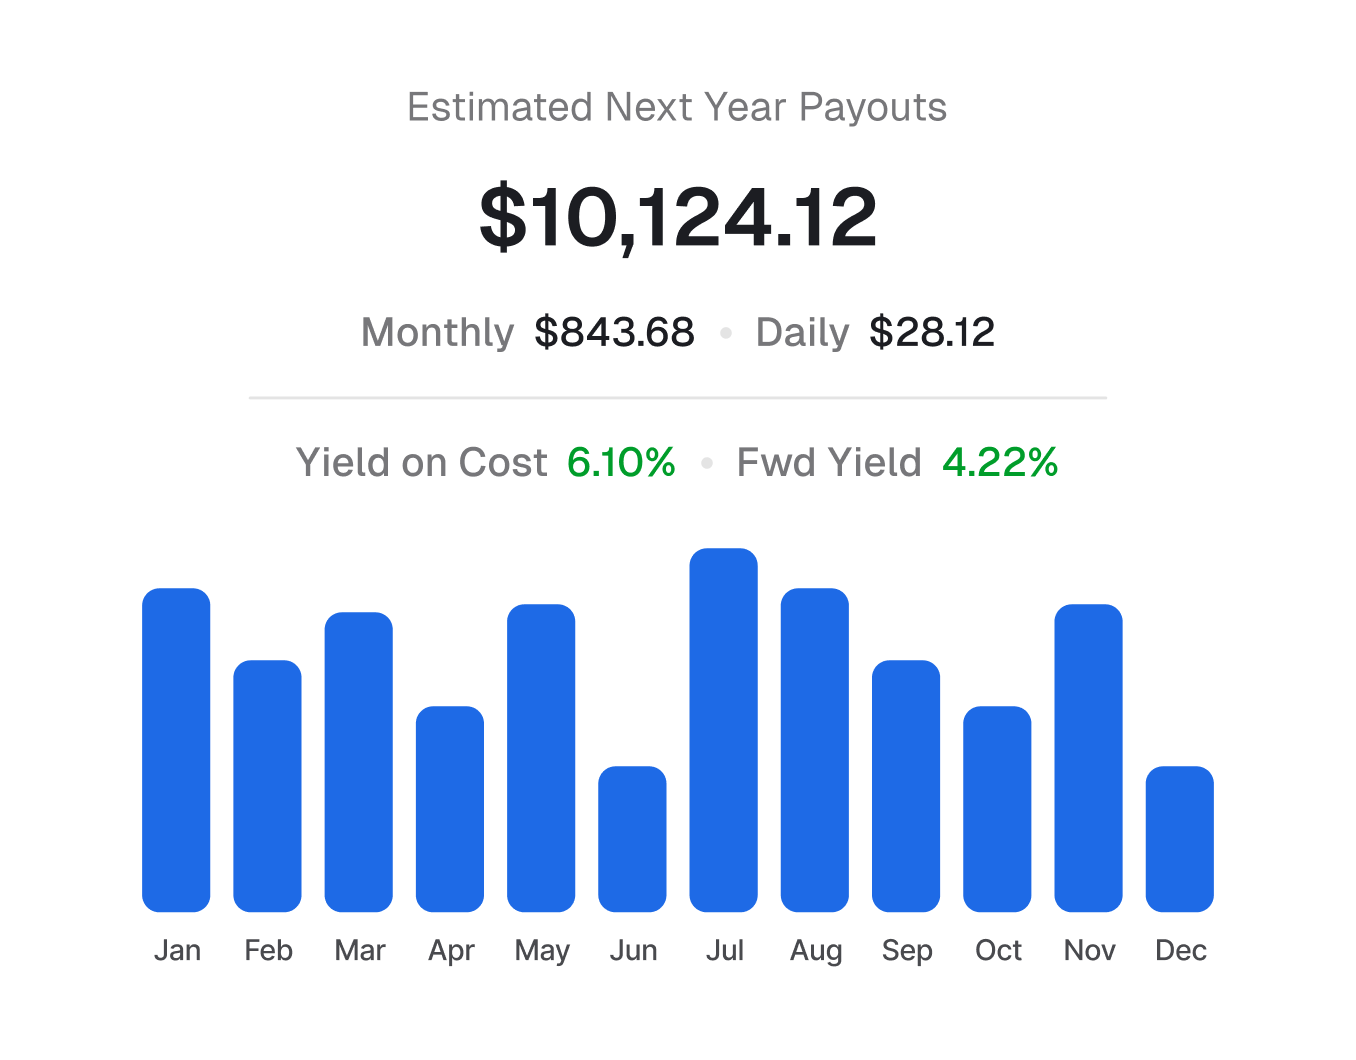
True Performance & Real Returns
Powerful Tools for Smarter Decisions
Screen stocks, calculate fair value, and compare financial metrics, all in one place.
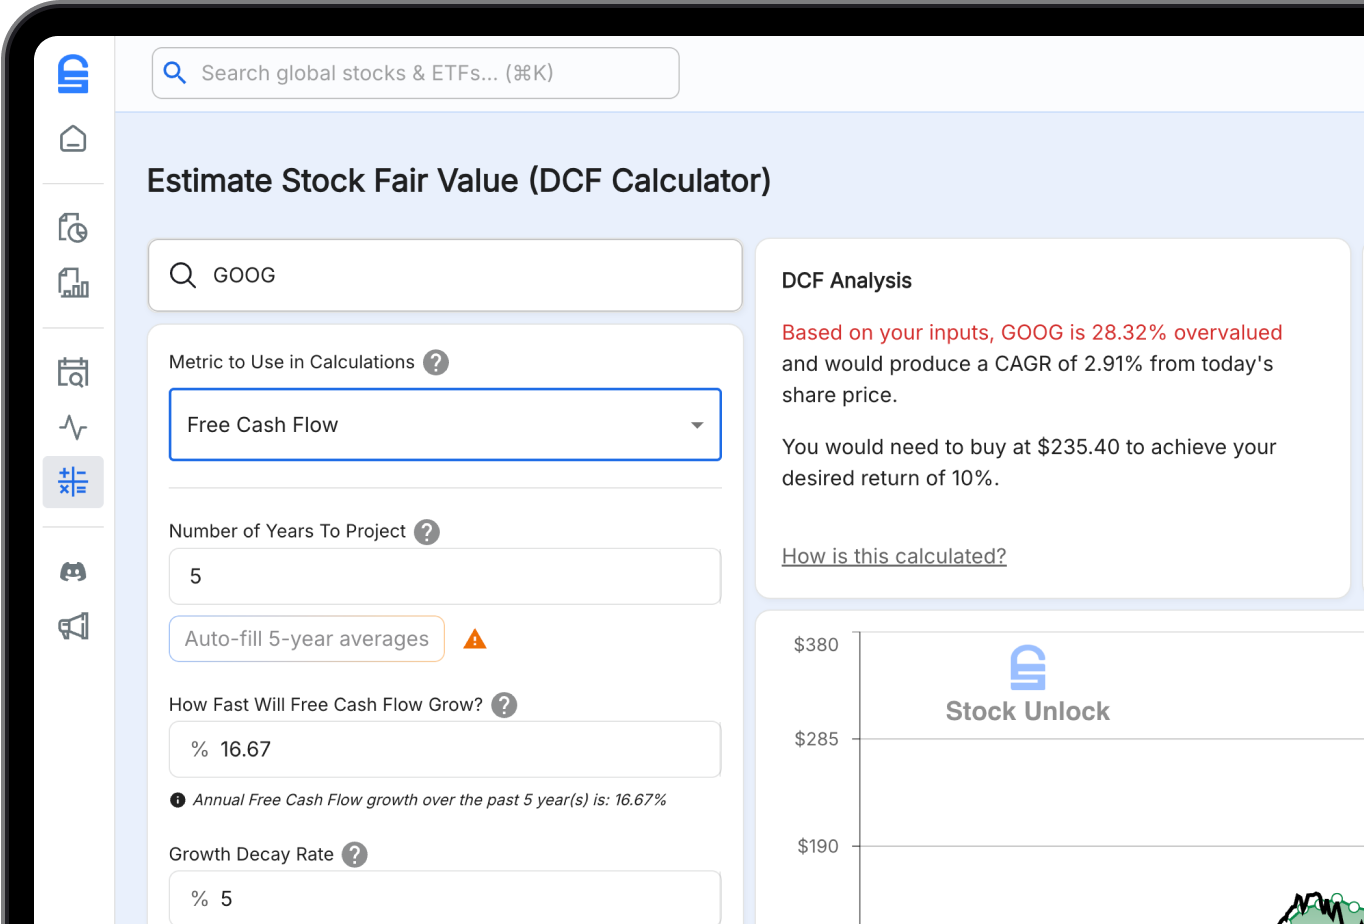
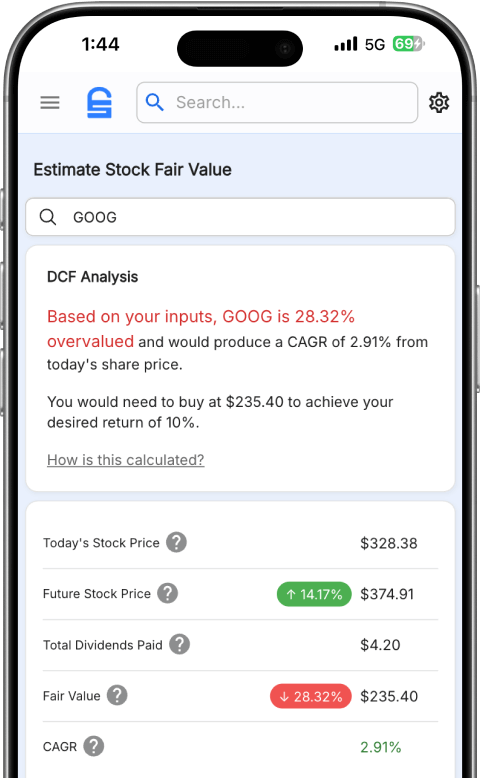
Calculate Fair Value Instantly
7 valuation metrics, automatically loaded with up to 35 years of data. Focus on your assumptions, not data entry.
Find The Best Stocks & ETFs In Seconds
Filter 100,000+ stocks and 50,000+ ETFs by what actually matters: 85+ filters, score-based ranking, no spreadsheets.
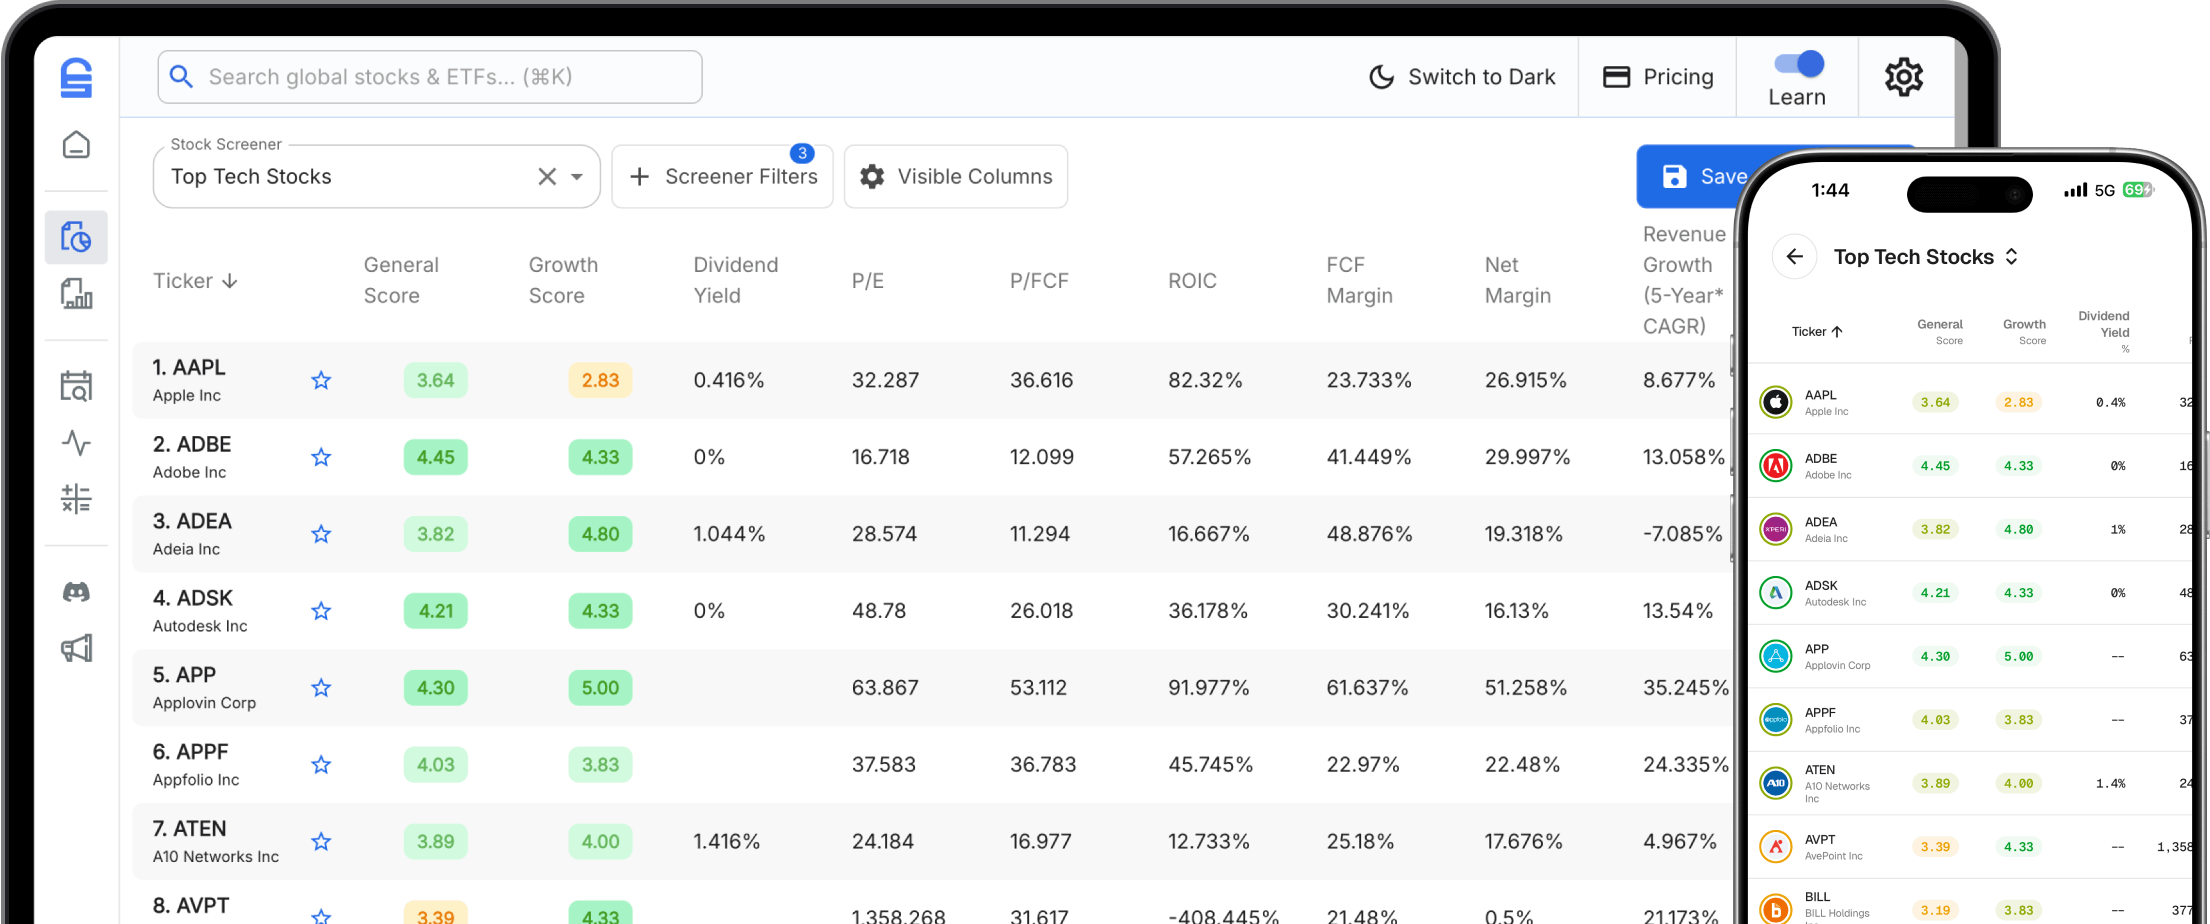
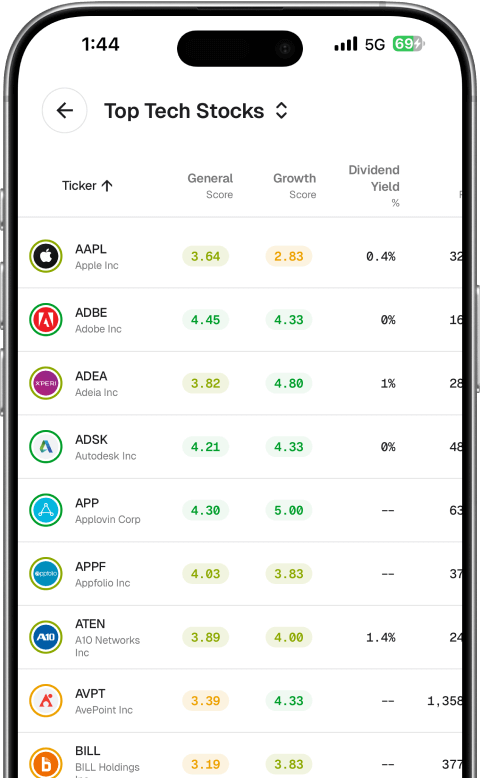
Chart Any Metric Across Stocks
Compare 80+ financial metrics across multiple companies with built-in statistics.
Start Comparing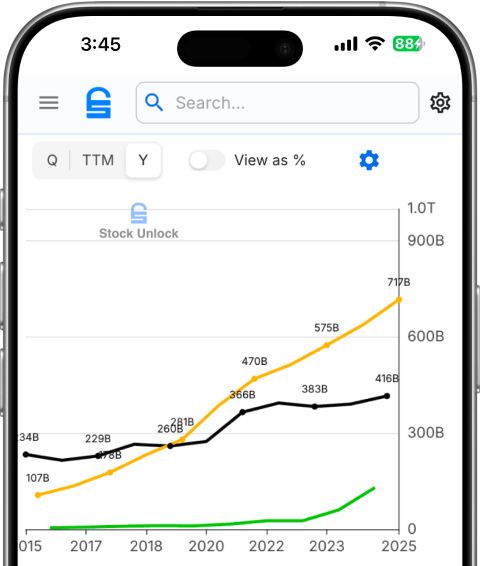
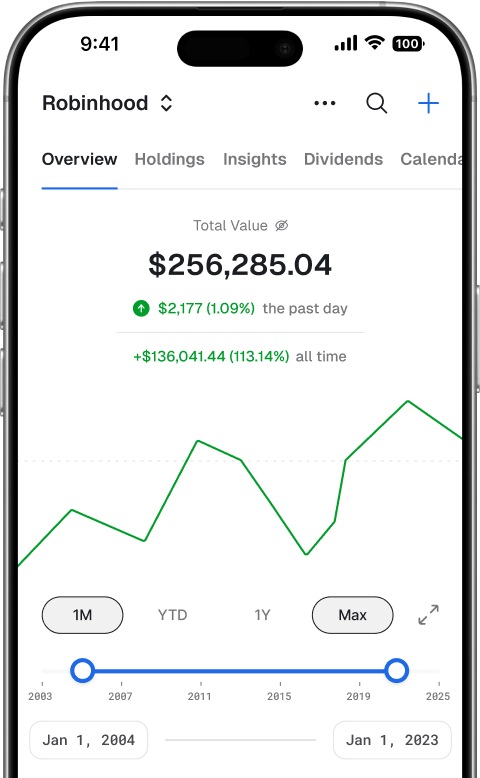
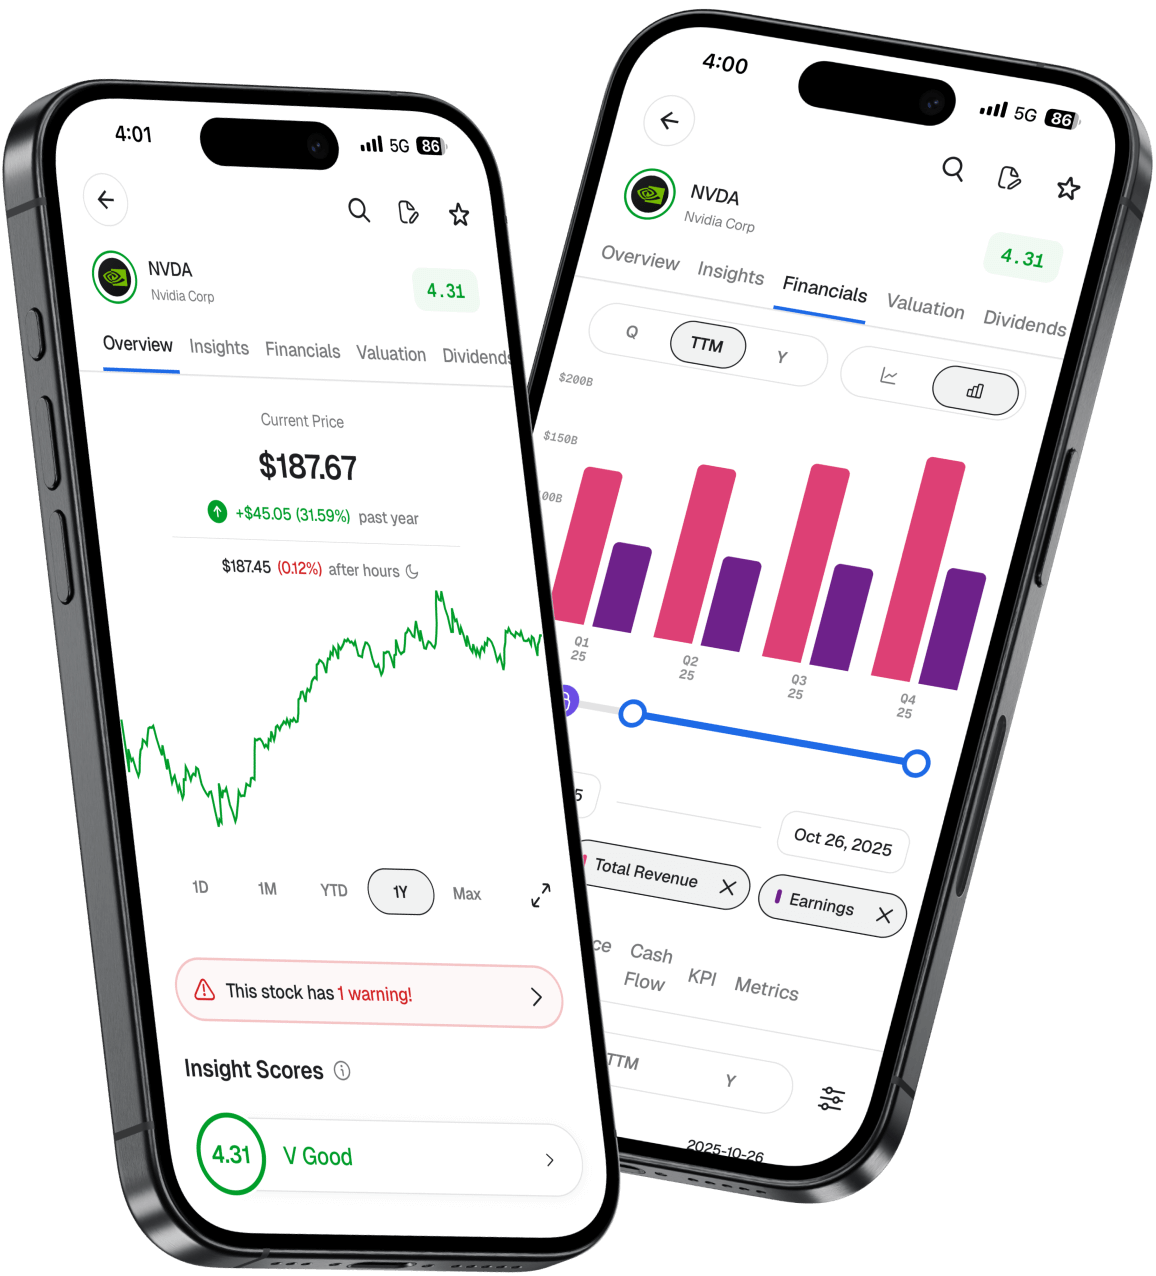
Your Portfolio, Anywhere
Take the full power of Stock Unlock with you. Track holdings, check scores, and research stocks, all from your pocket.
Everything is Free to Explore
No account required. No credit card. Click any link below and start exploring right now. Crawl through any stock, use every tool and feature. We put our value on our sleeve.
View NVDA
Full stock page
GOOGL Stock Scores
Full access
AAPL Financials
Income, balance, cash flow
DCF Calculator
Estimate fair value
MSFT Insider Data
Unlimited access
Demo Portfolio
See all features
JNJ Dividends
Dividend history
Stock Screener
Advanced search
ETF Screener
Browse global ETFs
Compare Stocks
Free account required to compare
Want to save your work?
Create a free account to save watchlists, create portfolios, and get 3
screener searches per week.
No credit card required, free forever.
Frequently Asked Questions
Everything you need to know about Stock Unlock
Is Stock Unlock really free?
You can use Stock Unlock completely free without creating an account. Just search for any stock (like Apple) and explore our Stock Scores, financial data, and analysis tools. No signup required.
Creating a free account unlocks additional features like watchlists, portfolios, and more Stock Score views, and it's free forever with no catch. Thousands of investors have upgraded to paid plans for deeper historical data (up to 35 years), unlimited Stock Scores, brokerage connections, and advanced tools. All paid plans include a 30 day money back guarantee.
Is there a Stock Unlock mobile app?
Yes. Stock Unlock has native mobile apps for both iOS and Android, and they're completely free. Download from the App Store or Google Play to access your portfolios, Stock Scores, watchlists, and all core features on the go. The mobile app syncs seamlessly with your web account, so your data is always up to date across all devices.
Can I really connect my brokerage for free?
Yes. All free accounts can connect one brokerage account free for 15 days, no credit card required. This is something most competitors don't offer, and we do it because we really want to lead with our value. Connect your brokerage and see automatic portfolio updates, dividend tracking, and performance analytics all working seamlessly.
After 15 days, your portfolio is not going to get deleted or removed. Your free account will still show your portfolio, but if you really enjoy what you get, you can optionally continue to pay if you want the connection to continue auto updating or if you want to connect more portfolios.
We have to pay per month per user to keep the connections alive, since it's an expensive thing to do given all the security and complexities connecting across all these different brokerages.
How do you connect to my brokerage?
We partner with SnapTrade, a secure financial technology provider, to connect your brokerage account. The connection is read only. We can view your holdings and transactions for portfolio tracking, but we never see your login credentials and cannot execute trades or move money.
All free accounts can connect one brokerage account free for 15 days, no credit card required. This lets you test everything and see automatic portfolio updates. After 15 days, your free account will still show your portfolio, but automatic updates require a paid plan. To connect multiple brokerage accounts, upgrade to our Unlimited plan. We support dozens of major brokers including Fidelity, Schwab, TD Ameritrade, Robinhood, Questrade, Interactive Brokers, and many more.
Where does your data come from?
We source most of our financial data from Finnhub, a leading provider of institutional-grade financial data. Our segment-level KPI data comes from Fiscal AI. We standardize all financials according to GAAP standards for consistency and reliability.
We built Stock Unlock partially because we found that many other sites, including Yahoo Finance, have tons of data errors, and that's unacceptable. Retail investors deserve something better. Our data covers 170,000+ stocks and ETFs across 70+ global exchanges, with up to 35 years of historical data available on premium plans. Financial statements are updated as companies file quarterly reports with regulatory bodies.
What are Stock Scores?
Stock Scores are presented in such a clear way that even someone new to investing can click around and familiarize themselves with the scores and figure it out. The magic behind all this is that while it's a complex mathematical system that calculates these scores, we've made it accessible to everyone.
This is not a cheap single algorithm for every stock. Stock Scores are our unique, highly sophisticated algorithmic system built and battle tested for years. Our fundamentals focused algorithms are specific to different stocks and industries, with scores tailored to the specificities of each company. You'll see group breakdowns across Profitability, Valuation, Financial Health, Growth, Dividends, and Management.
The most popular breakdown is Valuation, which works well for most stocks. It accurately shows whether a stock appears cheap or expensive relative to its fundamentals and growth rates. This can inform investors as to whether a stock may or may not be overvalued or undervalued right now, though this is obviously not a buy/sell signal or a recommendation. Stock Scores help save experienced investors time and show new investors where to start. See NVIDIA's Stock Scores in action.
What is Learn Mode?
Learn Mode is a feature available on the web that acts like training wheels on a bicycle. When Learn Mode is on, helpful pop ups appear all over the app defining all the terms you're looking at. We consistently get feedback that this is an excellent feature that really allows even newer users who couldn't be using other stock applications to use Stock Unlock.
As you click through Stock Scores and other features, questions pop up explaining what you're seeing. For all the experienced investors who don't need this, it's very simple to just toggle off. Learn Mode makes Stock Unlock accessible to everyone, whether you're new to investing or a seasoned pro.
Still have questions?