Institutional-Grade Tools.
Retail Price.
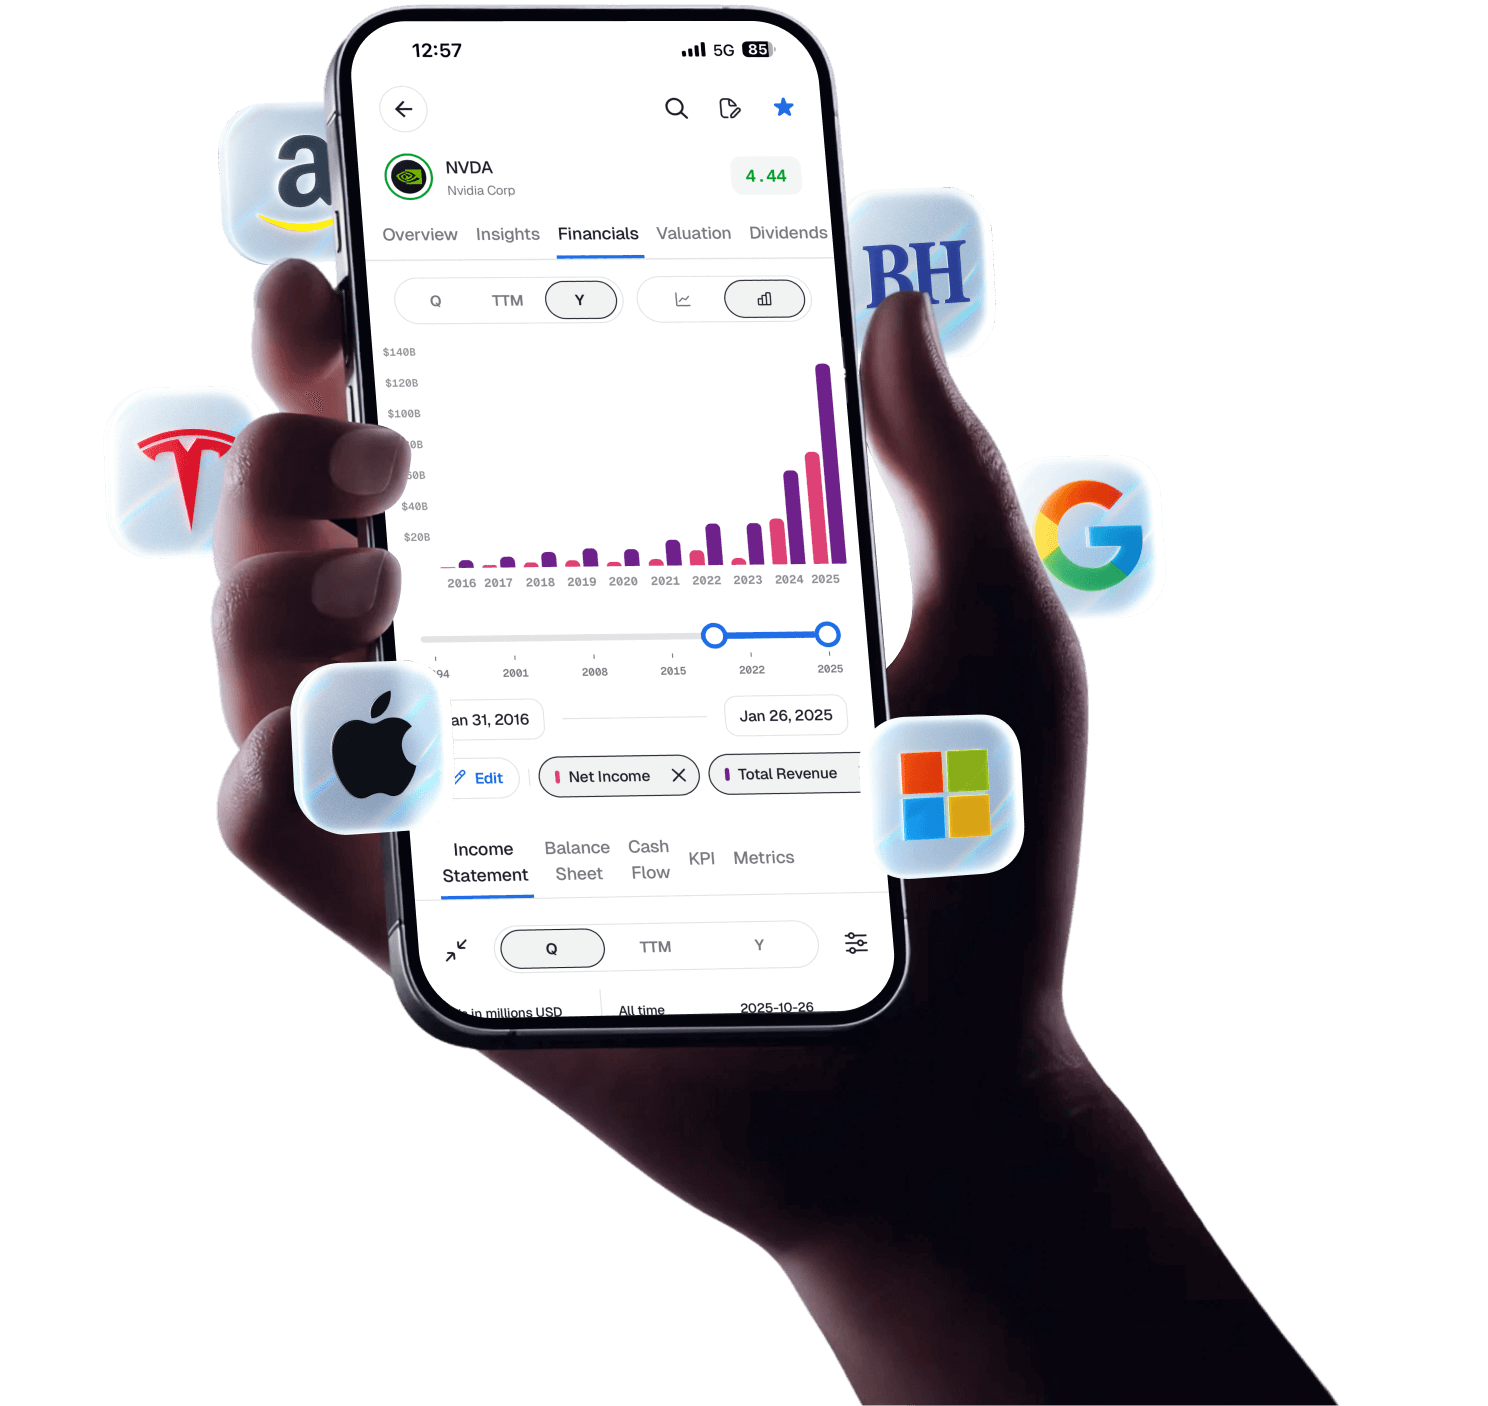
Replace your fragmented spreadsheets with one powerful platform. Deep fundamentals data, fair value models, and portfolio tracking that actually works.
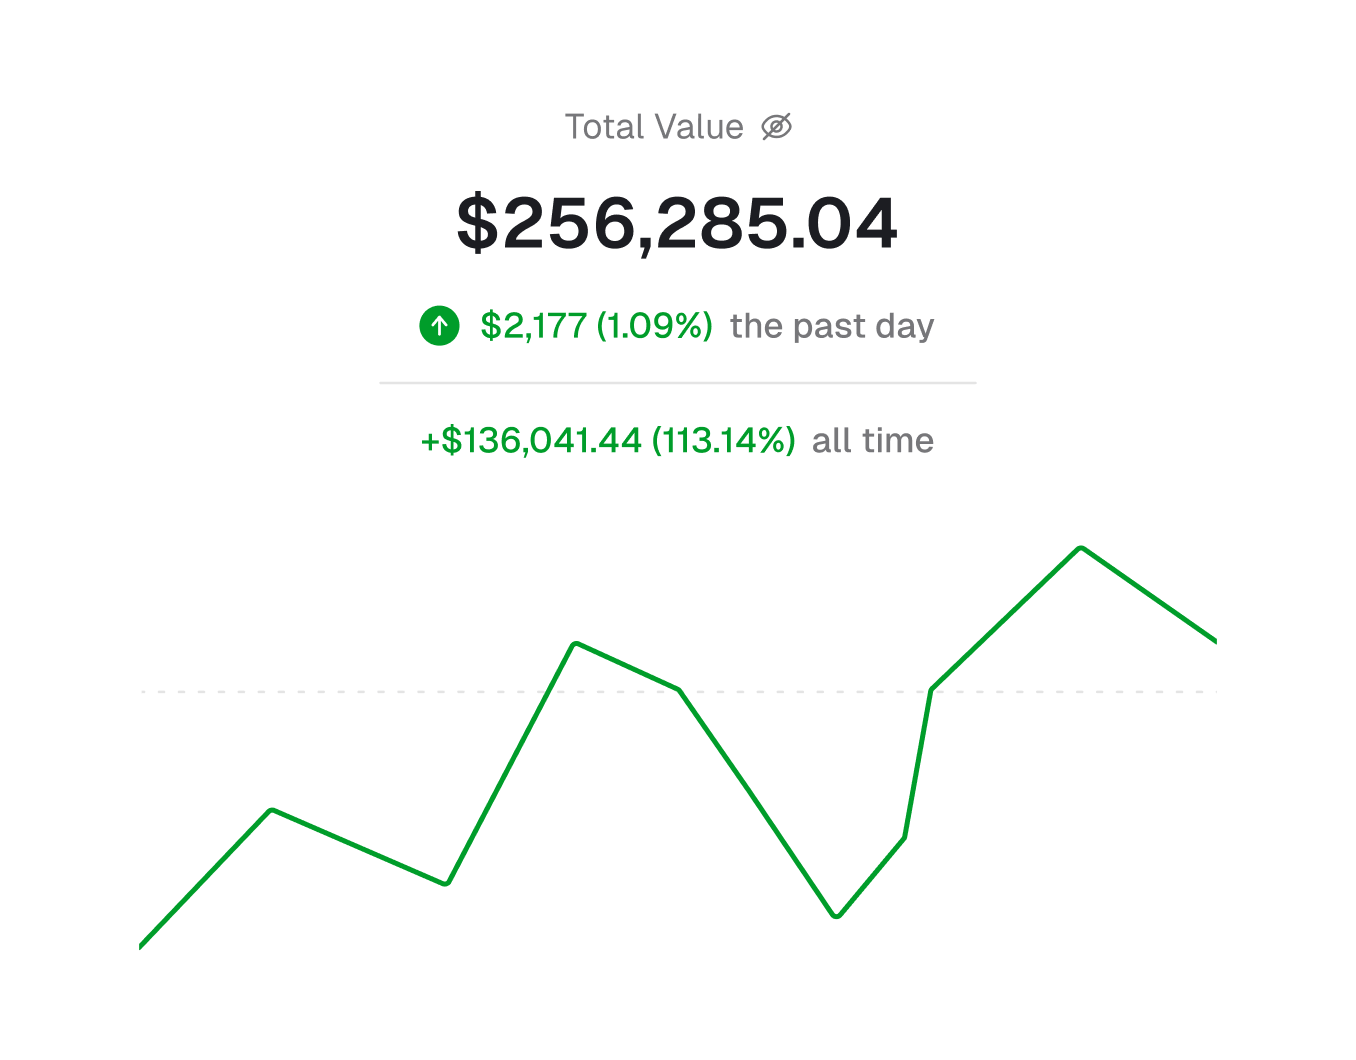
Track Performance Like a Fund Manager
True time-weighted returns, realized vs. unrealized gains, and future dividend income forecasting. 10+ return calculation methods to understand your actual performance.
Benchmark against the S&P 500, any ETF, or any stock. Compare your performance to whatever matters to you.
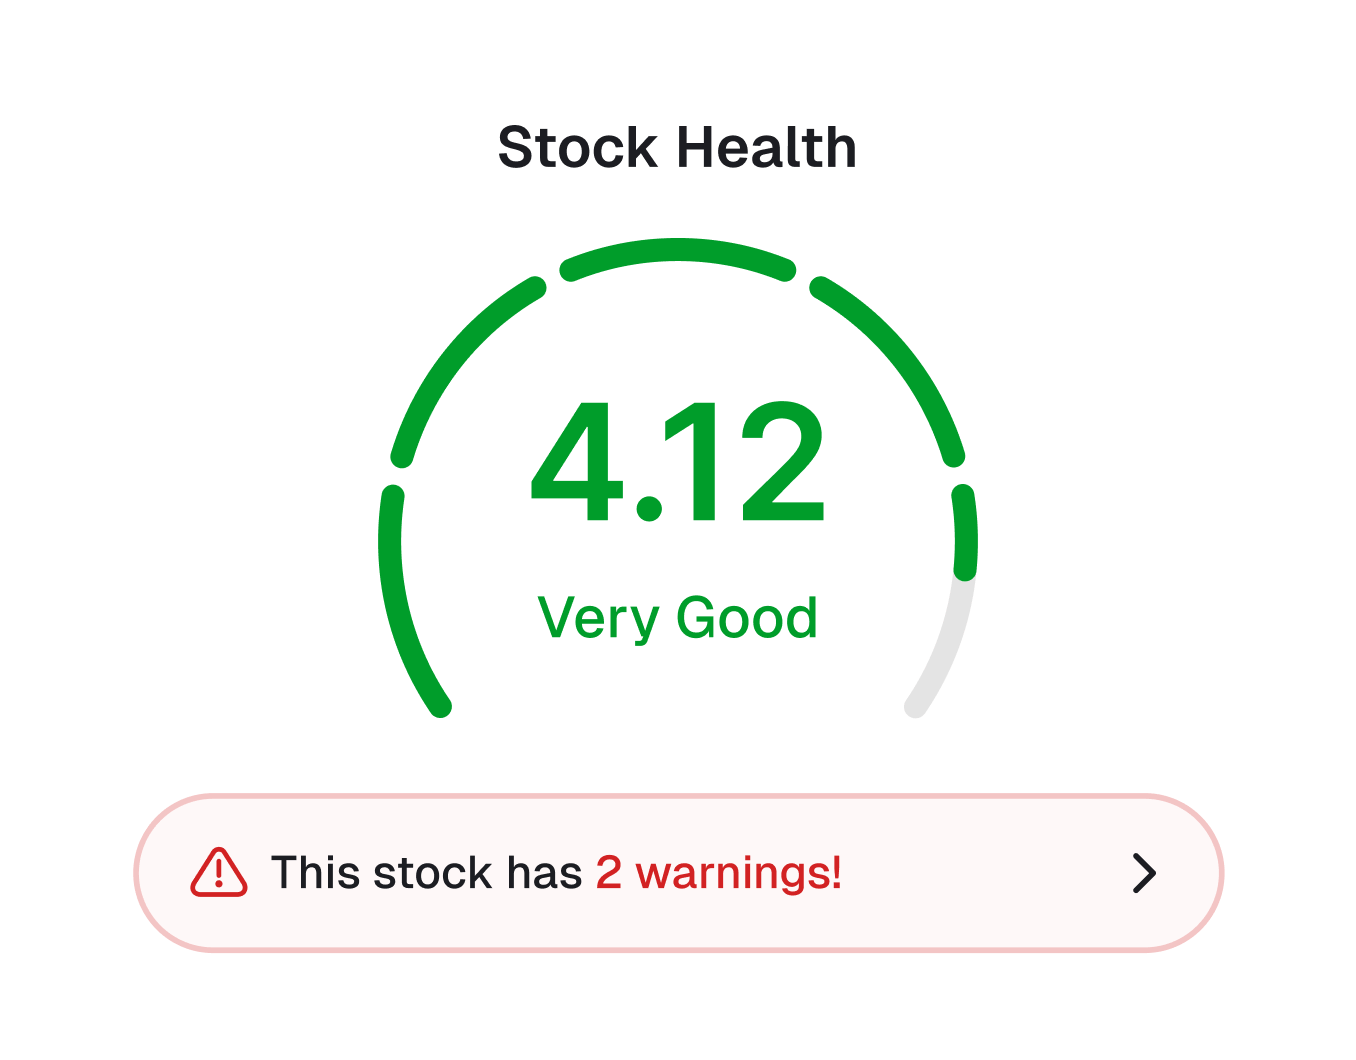
Quantitative Quality Scores
Eight scoring dimensions: Valuation, Financial Health, Profitability, Growth, Dividends, Returns, Analyst sentiment, plus an Overall Score. Each uses sector-specific algorithms refined over years of back-testing.
Banks, REITs, and tech stocks are evaluated on metrics that actually matter for their business model. Validate your thesis against our scoring system in seconds.
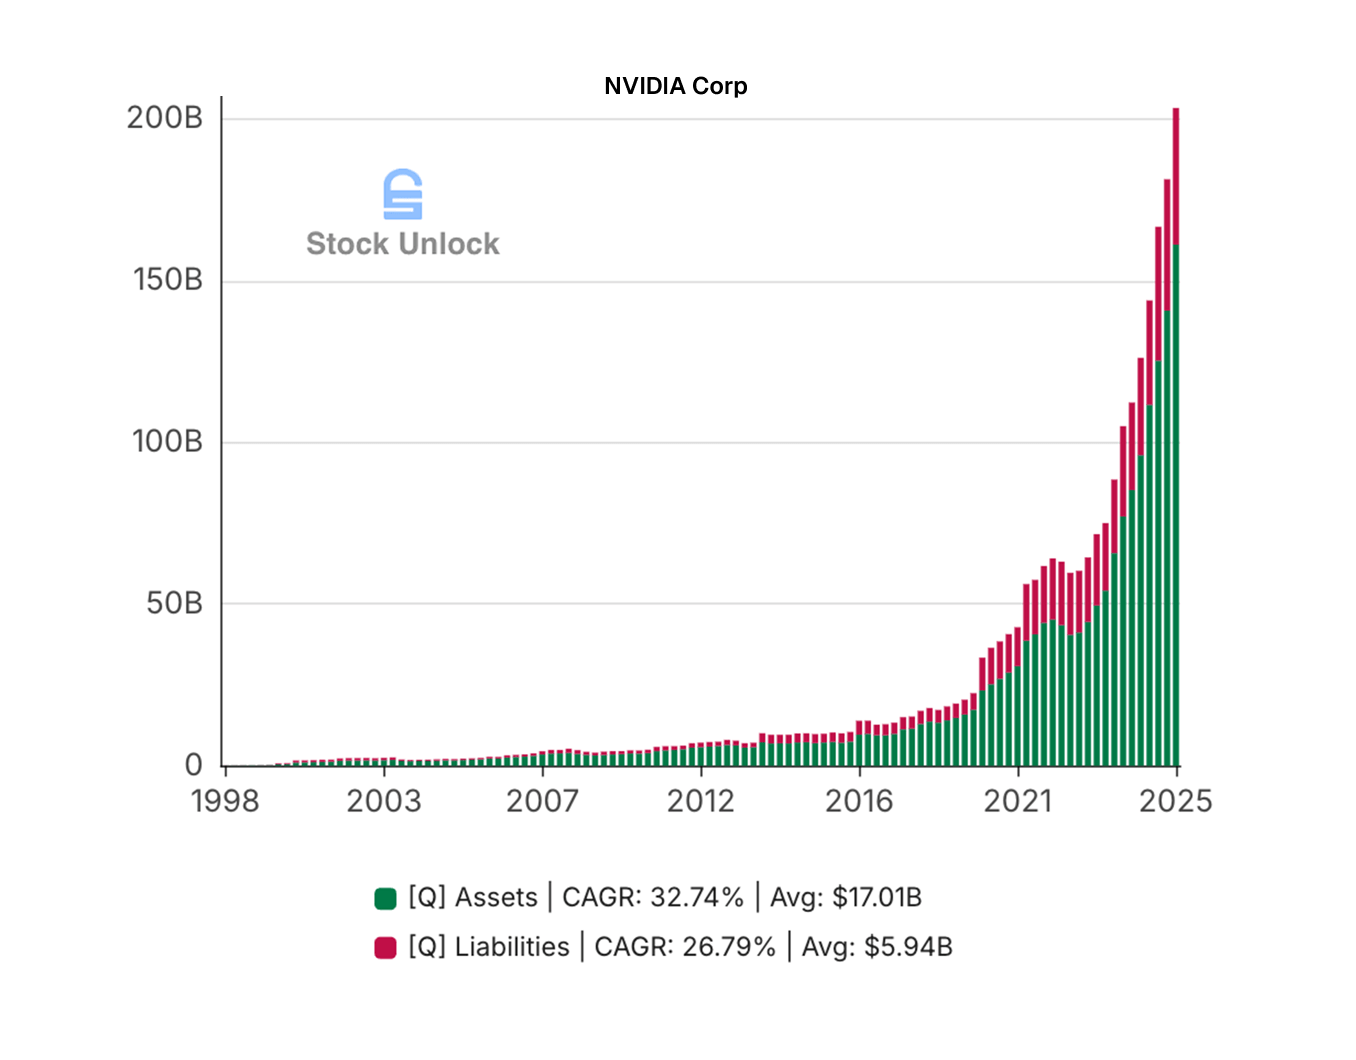
Visualize Up to 35 Years of History
Spot trends that spreadsheets hide. Plot Free Cash Flow, ROIC, Margins, and Book Value over decades with a single click.
Not just for US stocks. Analyze global equities and ETFs with the same depth.
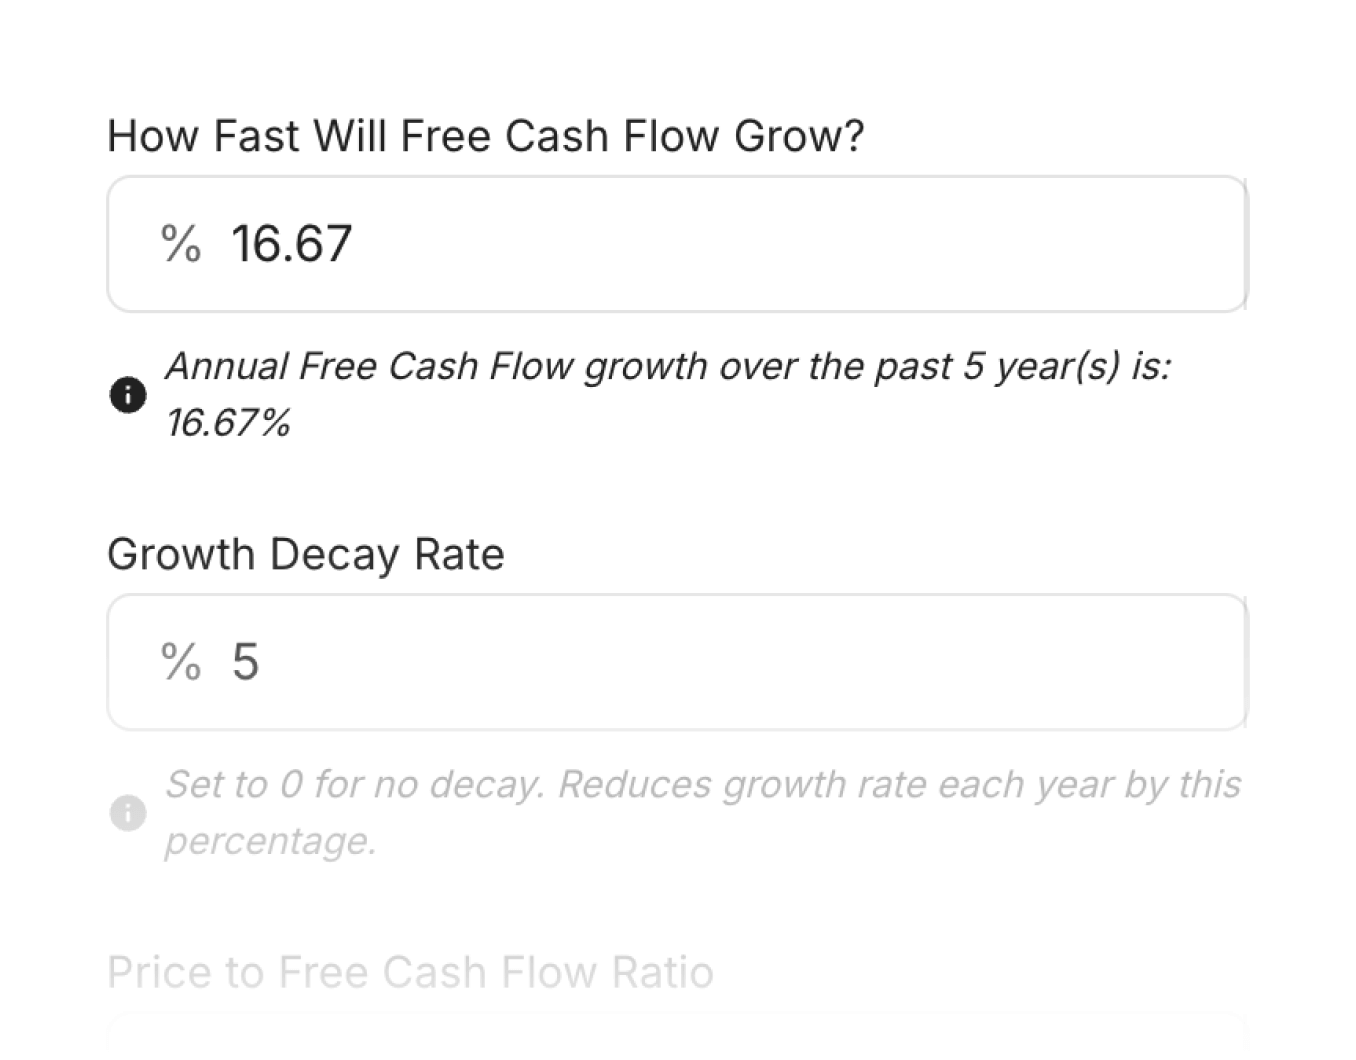
Your Assumptions. Our Data.
Skip the manual data entry. We pre-load company fundamentals and analyst estimates so you can focus on the inputs that matter: growth rates, margins, and discount rates. Project 1-10 years forward with Growth Decay modeling for realistic projections. Full control of a spreadsheet, zero grunt work.
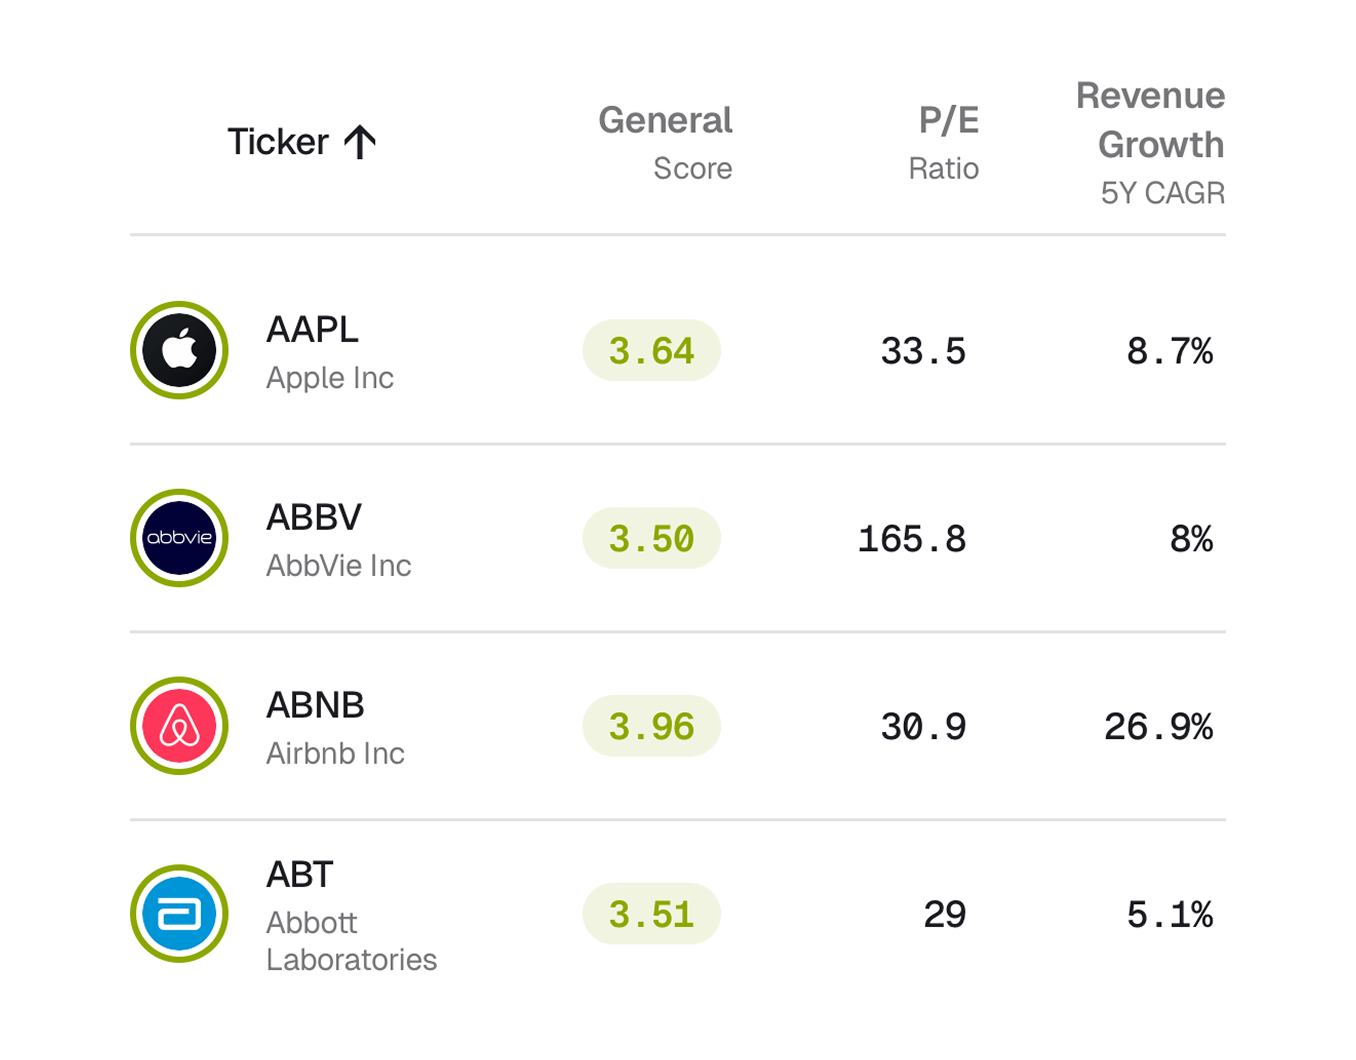
Filter the Noise.
The market is noisy. Cut through it. Screen 100,000+ stocks with 85+ filters across Valuation, Growth, Profitability, Cash Flow, Dividends, Financial Health, and Analyst Ratings, or screen 50,000+ ETFs by ETF Scores, Expense Ratio Rating, AUM, and more.
Screens are lightning fast, easy to share, and just work. Save your criteria and get alerted when new opportunities hit your strike zone.
Why Pros Switch
(And Never Look Back)
The Old Way
-
Manual Spreadsheets
Error-prone, static models that break easily and require constant manual data entry.
-
Expensive Terminals
Paying $24k/year for financial data that should be accessible to everyone.
-
Fragmented Data
Checking 5 different websites just to piece together a complete thesis on one stock.
The Stock Unlock Way
-
Automated Data
Always fresh. Up to 35 years of standardized financial history at your fingertips instantly.
-
All-in-One Platform
Research, screening, valuation, and portfolio tracking in one powerful place.
-
Maximum Efficiency
Analysis that used to take days now takes minutes. Focus on decisions, not data entry.
Analyze High-Quality Compounders
Deep dive into the world's best businesses. Wide moats, strong returns on capital, and proven management teams.