Qualtrim has earned a following among retail investors who appreciate its clean, data-focused approach to stock analysis. Created by YouTuber Joseph Carlson, the platform delivers over 30 years of financial data through visualizations, AI-powered analysis, and a professional DCF calculator, starting at $9.99 per month.
But as your investment journey evolves, you might find that a data visualization tool, while excellent for what it does, doesn't quite fit every need. Perhaps you're a beginner who wants more guidance on what the numbers actually mean. Maybe you need institutional-grade data for professional research. Or you might want access to community perspectives and diverse analyst opinions to stress-test your investment theses.
That's where this guide comes in. We'll explore dedicated Qualtrim alternatives that excel in specific areas, whether you're looking to:
- Consolidate multiple tools into one complete investing platform while learning along the way
- Access community-driven research and multiple analyst perspectives
- Use Bloomberg-style professional analytics at accessible pricing
- Visualize company fundamentals through intuitive infographics
- Deep-dive into dividend safety and income forecasting
- Start with zero financial commitment using free tools
- Access institutional-quality data from S&P Capital IQ sources
Some investors might use these tools to complement their existing Qualtrim setup, while others might find one that better fits their evolving needs. This isn't about finding a "better" platform; it's about finding the right fit for where you are in your investment journey.
Let's dive in.
| The Best Qualtrim Alternatives | ||
|---|---|---|
|
|
Starts at: $0 (Free tier) |
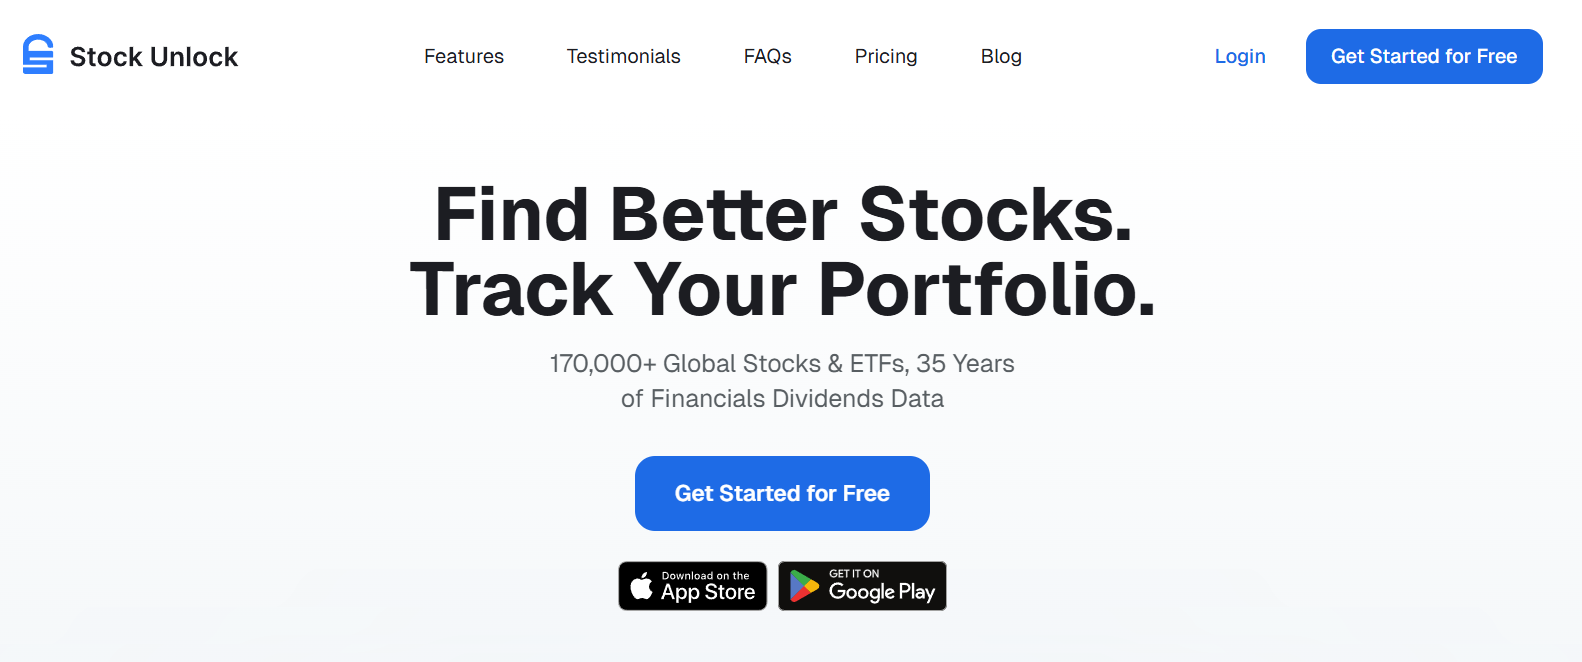
Stock Unlock Best Alternative for a Complete Investing Toolkit with Integrated Education We chose Stock Unlock because it is the only platform on this list that combines all of these capabilities with integrated education through Learn Mode: powerful portfolio tracking, proprietary Stock Scores, and a DCF calculator, all in one platform. Built by frustrated investors who were tired of juggling multiple expensive tools, it's the complete package at an accessible price point. |
|
|
Starts at: $299/year |
Seeking Alpha Best Alternative for Community-Powered Investment Research We chose Seeking Alpha because it provides access to thousands of investment theses from 7,000+ contributors, offering diverse analyst perspectives that pure data platforms cannot match. |
|
|
Starts at: $39/month |
Koyfin Best Alternative for Enterprise-Grade Professional Analytics We chose Koyfin because it delivers Bloomberg-style terminal capabilities popular with financial advisors and institutional analysts, with institutional-grade data at a fraction of institutional pricing. |
|
|
Starts at: $10.95/month |
Simply Wall Street Best Alternative for Infographic-Style Visual Analysis We chose Simply Wall Street because its signature Snowflake diagram provides instant visual pattern recognition of company fundamentals, making complex data accessible at a glance. |
|
|
Starts at: $0 (Free tier) |
Snowball Analytics Best Alternative for Dividend Safety and Income Forecasting We chose Snowball Analytics because its proprietary Dividend Rating system analyzes 13 financial parameters to assess payment sustainability, going deeper than standard yield calculations. |
|
|
Starts at: $0 (Free) |
Yahoo Finance Best Alternative for Zero-Cost Investment Research We chose Yahoo Finance because it provides genuinely useful stock research tools, including a screener and portfolio tracking, completely free with no time limits or credit cards required. |
|
|
Starts at: $24.95/month |
TIKR Best Alternative for Institutional-Quality Data Access We chose TIKR because it sources data from S&P Capital IQ, offering 20 years of financials and 300+ screener parameters for serious fundamental analysts. |
Table of contents:
What is Qualtrim?
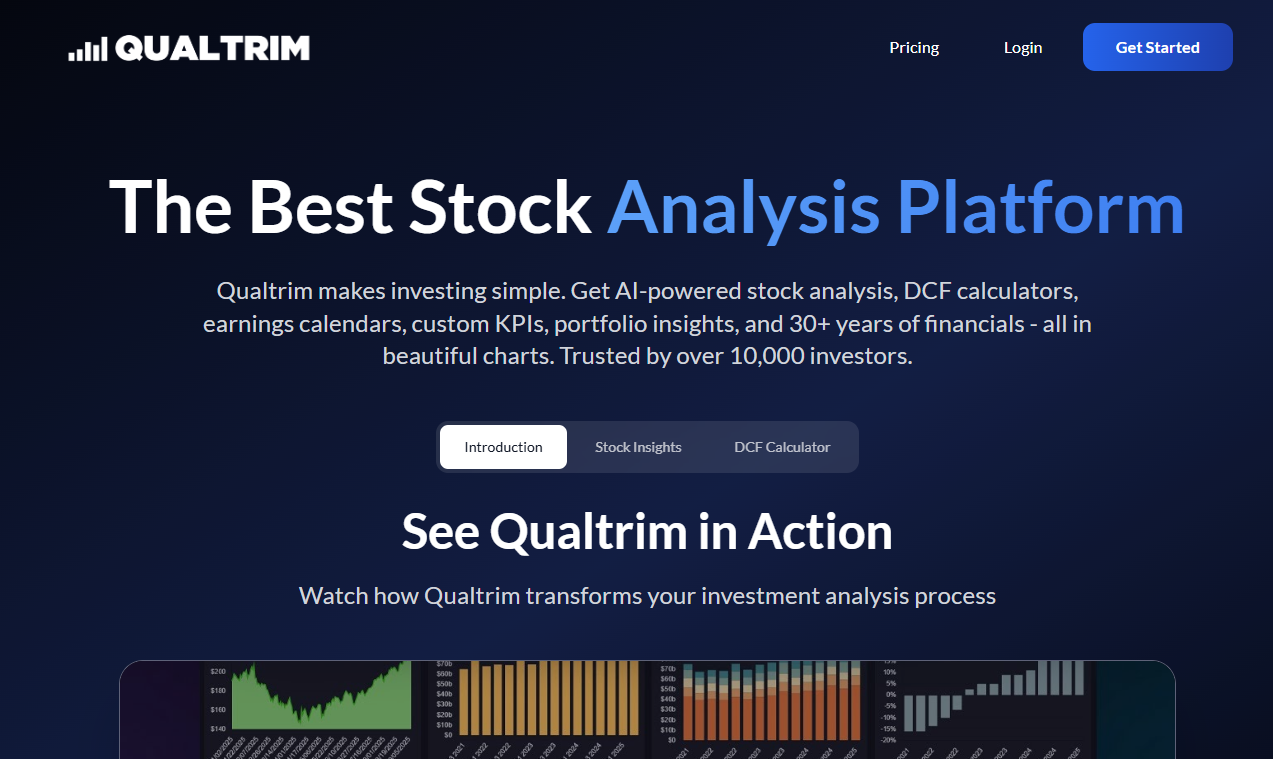
Qualtrim is a stock analysis platform designed to simplify investing through clear data visualization and fundamental metrics. Created by Joseph Carlson, a YouTuber with a popular investing channel, the platform was built as a more affordable alternative to expensive analysis tools, with pricing starting at $9.99 per month.
Its key features include:
- Comprehensive Stock Analysis: Multiple interactive charts covering Price, Revenue, EBITDA, Free Cash Flow, EPS, and key financial ratios
- AI-Powered Insights: AI-generated analysis and investment insights
- DCF Calculator: Built-in discounted cash flow tool for valuation analysis
- Basic Portfolio Management: Portfolio tracking with performance metrics and sector breakdowns
- Dividend Analysis: Dividend tracking with income calendars
- Earnings Calendar: Earnings tracking with access to historical data
- Watchlists: Custom watchlists with alerts
- 30+ Years of Historical Data: Extensive financial history for long-term trend analysis
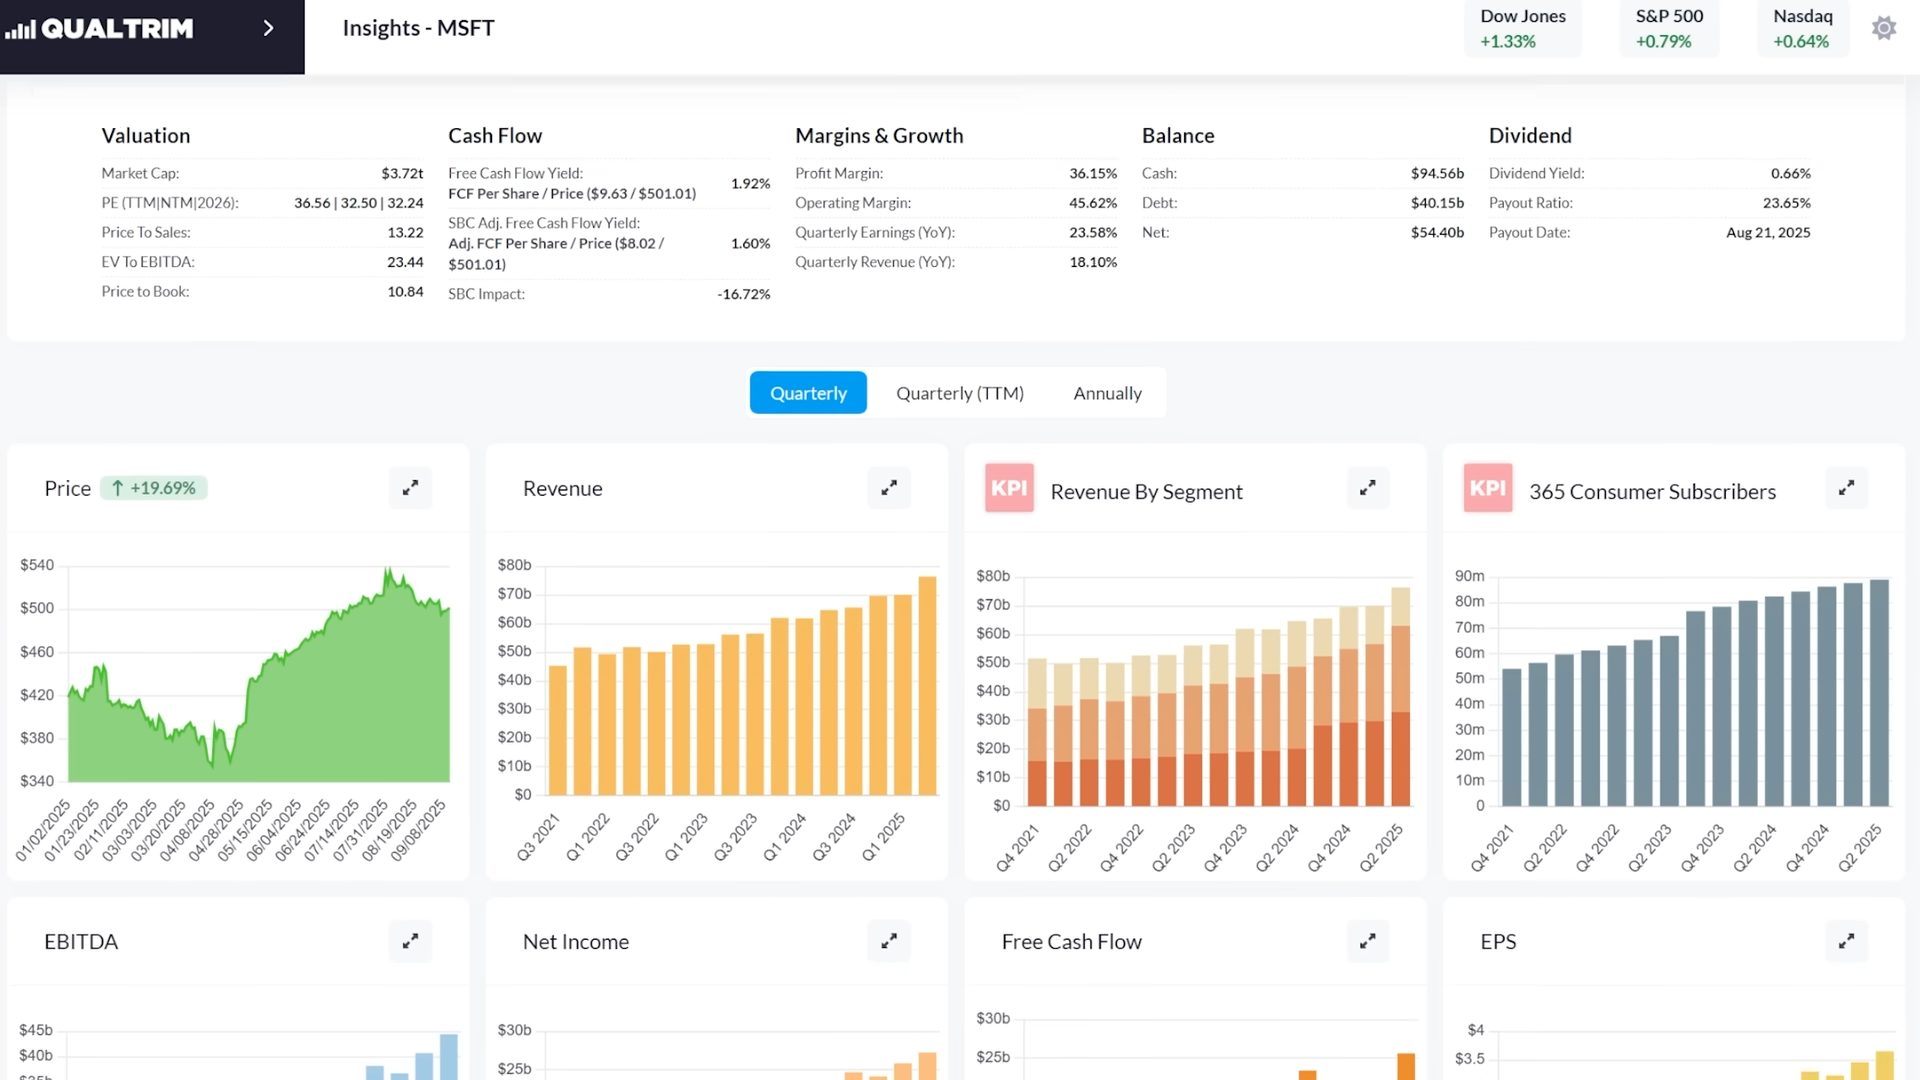
Source: Joseph Carlson After Hours
Qualtrim takes a data-focused approach, emphasizing pure data visualization rather than community forums, comment sections, or contributor articles. This design philosophy appeals to investors who prefer to analyze raw numbers and form their own conclusions without the noise of opinions.
For many fundamental and dividend investors, Qualtrim provides exactly what they need: clean charts, essential metrics, and straightforward tools at an affordable price. But as your analytical needs grow, or if you prefer more guidance alongside your data, you might find yourself looking for platforms that offer additional capabilities.
Looking for a complete investing platform that grows with you? Stock Unlock combines portfolio tracking, stock screening, dividend analysis, and valuation tools with integrated education, providing one platform instead of many. Create a free account and explore the entire site without a credit card.
How We Curated Our List of Qualtrim Alternatives
After testing Qualtrim and researching the stock analysis market, we found that while Qualtrim excels at presenting visual data for fundamental analysis, different investors have different needs that extend beyond pure data visualization.
We focused on finding platforms that excel where investors might need additional capabilities:
- Consolidating multiple expensive tools into one comprehensive platform
- Understanding what financial metrics mean, not just seeing them displayed
- Accessing diverse analyst perspectives and investment theses to stress-test ideas
- Using institutional-grade analytics without the Bloomberg price tag
- Visualizing company fundamentals through intuitive infographics rather than charts
- Deep-diving into dividend safety with specialized income-focused tools
- Starting with zero financial commitment while learning the ropes
- Accessing professional-quality data from institutional sources
Each platform on this list addresses one of these specific areas. You might use them to complement your existing Qualtrim setup, or you might find one that better fits your evolving needs as an investor.
❗ DISCLAIMER: We aren't covering every single stock analysis tool on the market! Our focus is on highlighting the best alternatives that address specific needs where investors might want capabilities beyond Qualtrim's data-focused approach. The goal is to help you find tools that match your particular situation.
1. Stock Unlock: Best Alternative for a Complete Investing Toolkit with Integrated Education
Stock Unlock is a comprehensive investment analysis and portfolio tracking platform that serves as a complete investing toolkit, supporting you from your first stock through your 40th year of investing. Like Qualtrim, Stock Unlock was co-founded by a popular investing content creator: Daniel Pronk (260K+ YouTube subscribers). The platform is backed by Y Combinator and Goodwater Capital, with a dedicated engineering team and native mobile apps on iOS and Android.
The founding story speaks to the platform's mission: back in 2020, Daniel Pronk was using multiple expensive tools and maintaining time-consuming spreadsheets. Jake Ruth, an engineer watching Daniel's videos, got frustrated seeing smart investors wasting money on poor-quality tools with misleading scores. He built a program to automate Daniel's spreadsheet work, and the two eventually connected to create something better.
Stock Unlock's key features include:
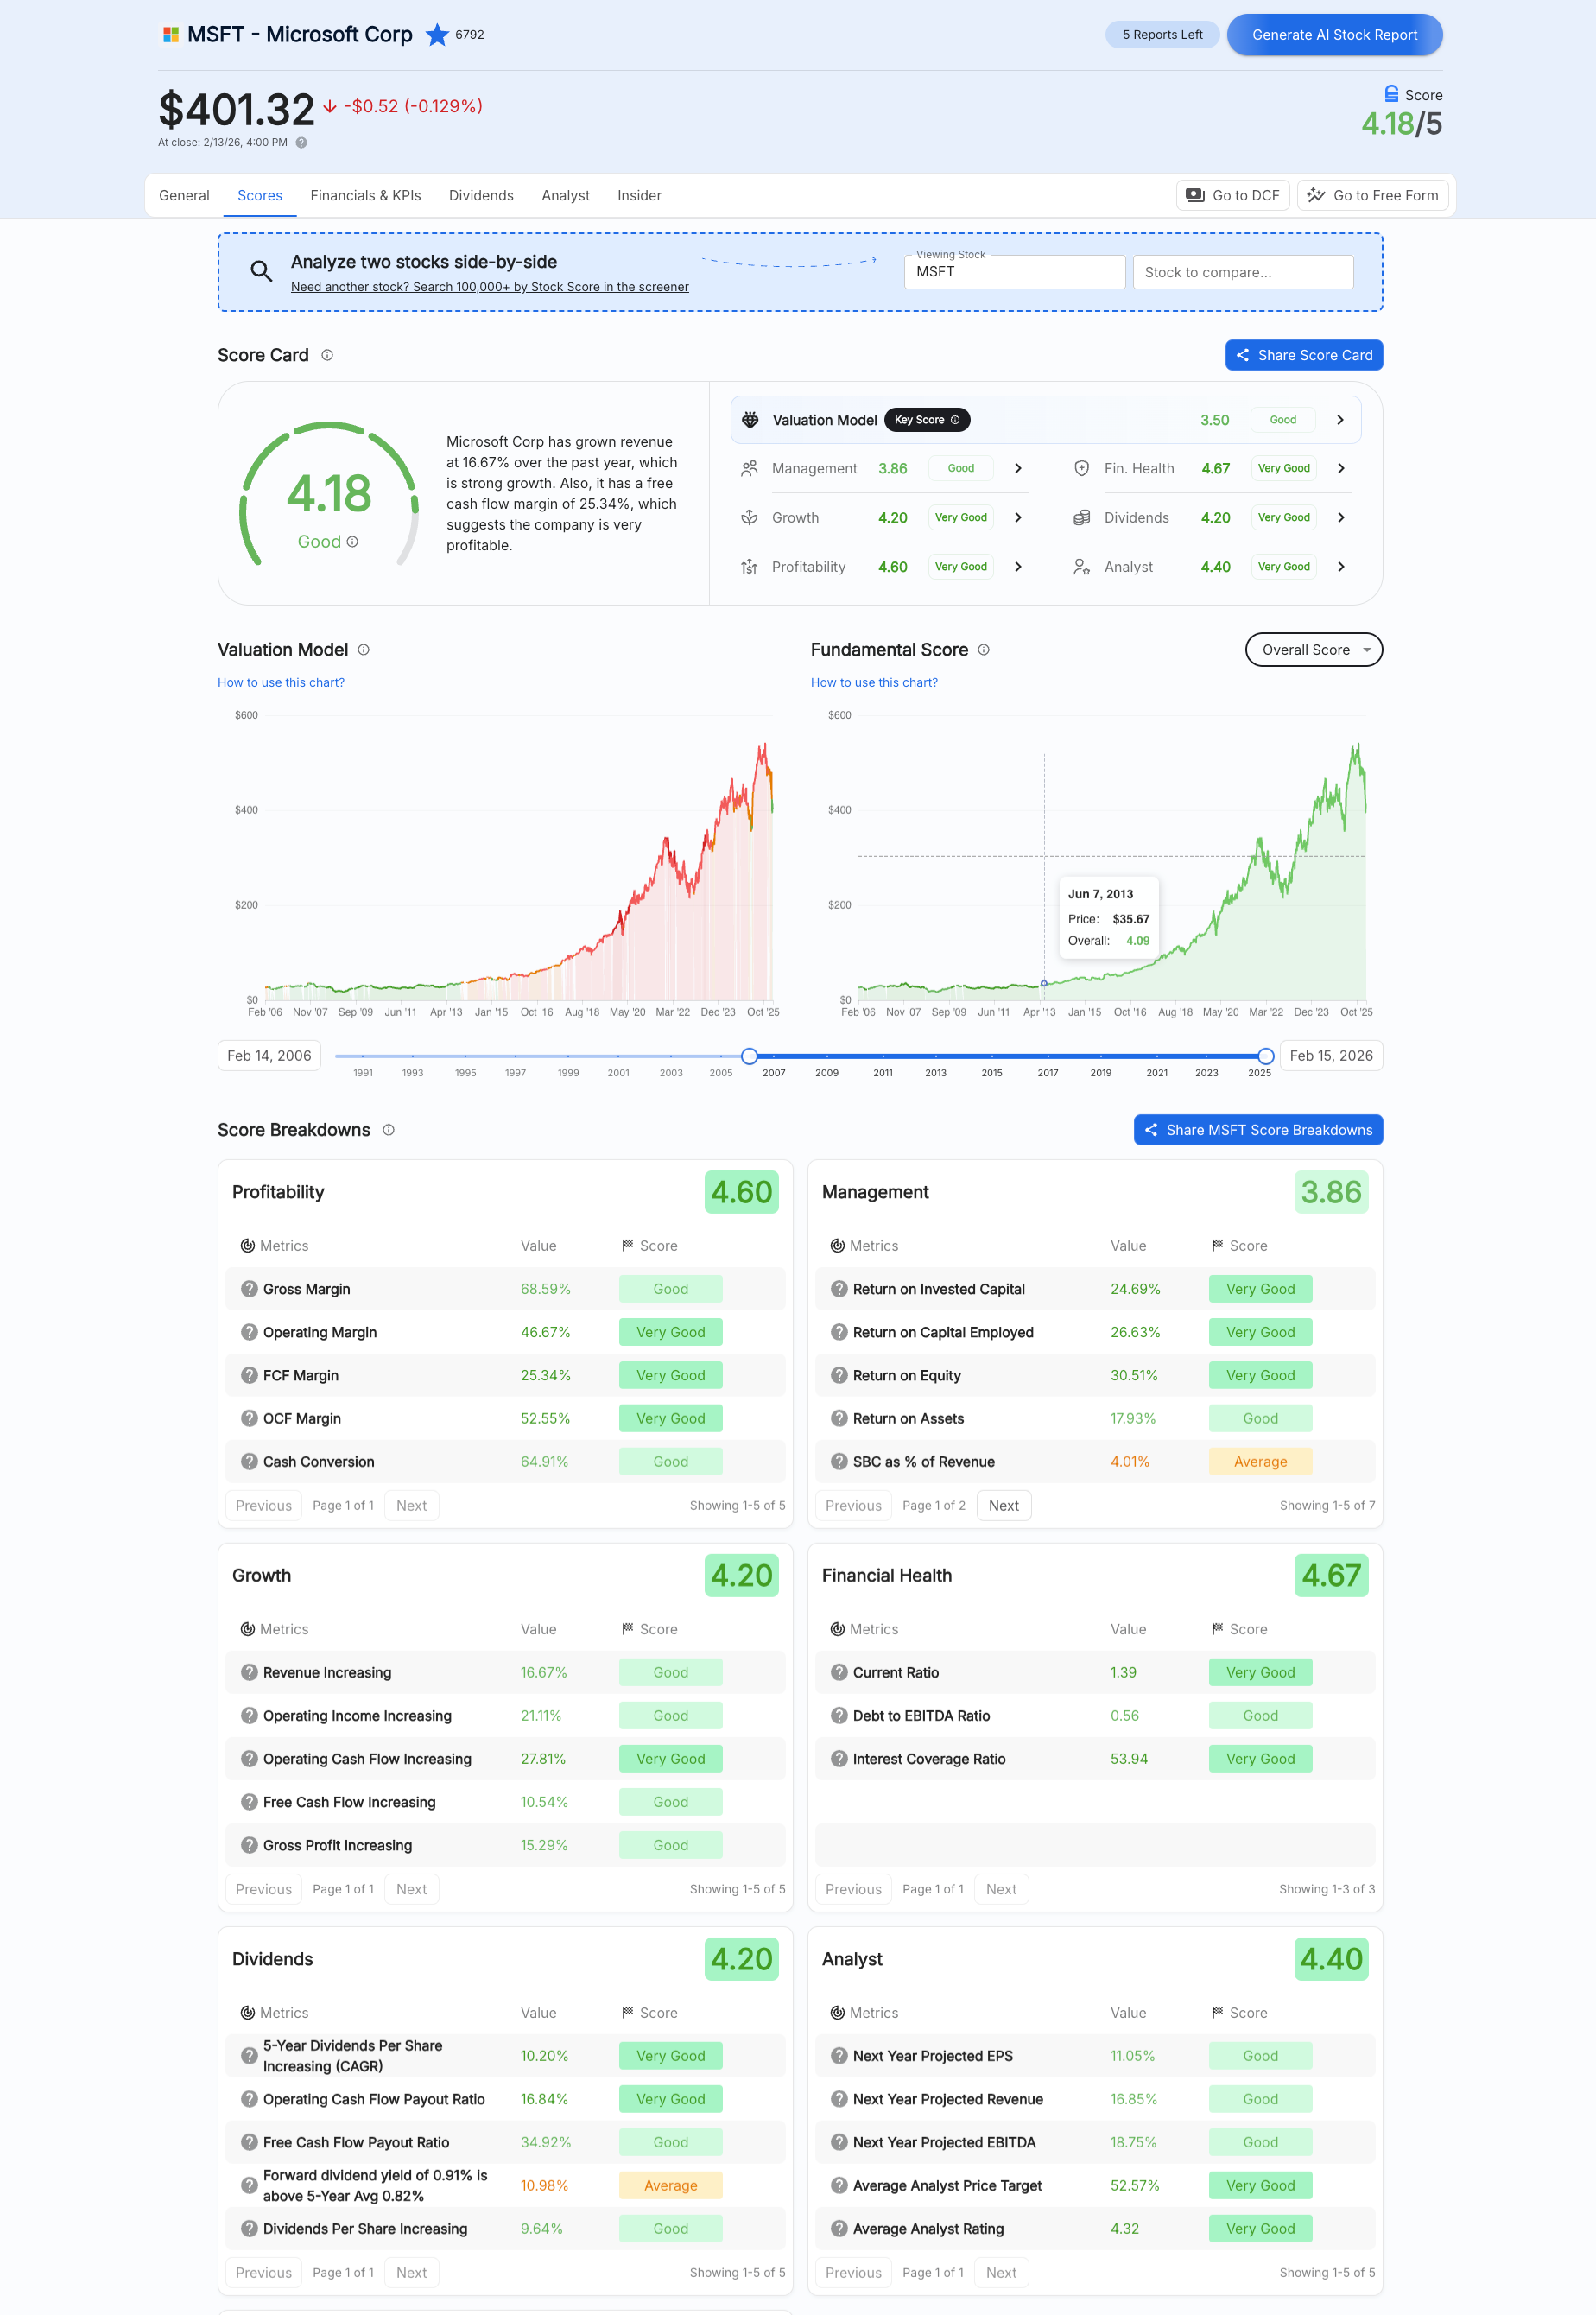
- Proprietary Stock Scores: Industry-specific scoring that evaluates stocks across Valuation, Growth, Profitability, Dividends, Financial Health, Management, and Analyst, which is calibrated uniquely for different industries, not generic algorithms
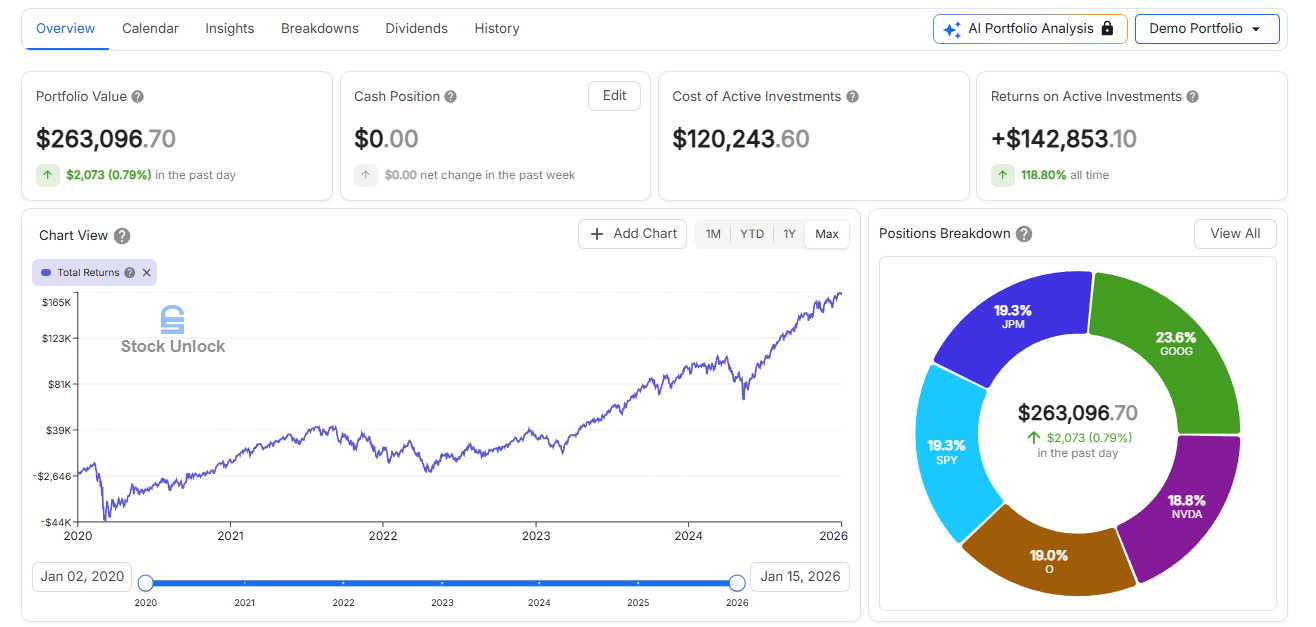
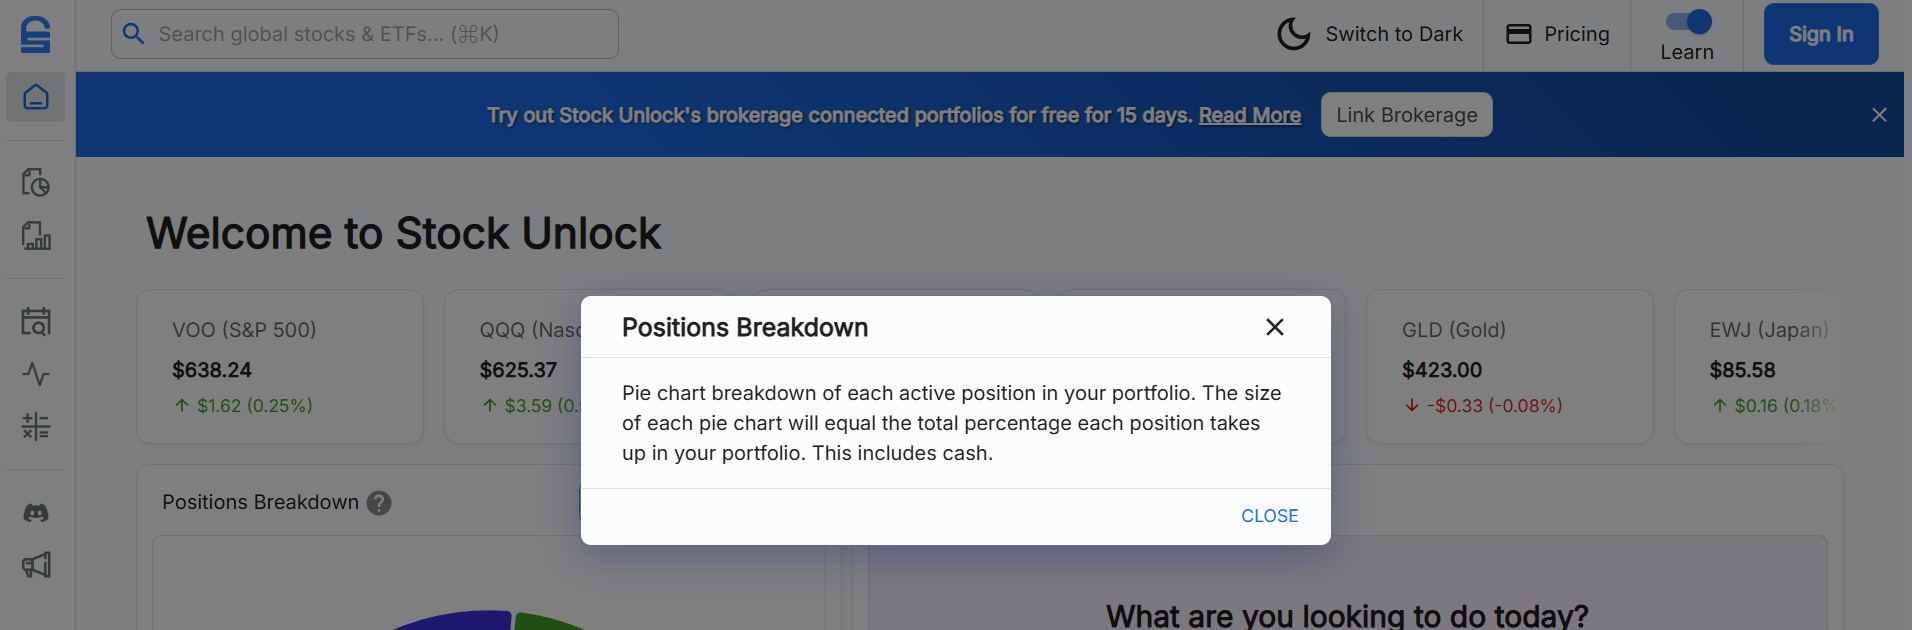
- Portfolio Tracking: Brokerage sync with 30+ supported brokers, time-weighted returns, dividend income forecasting, diversification breakdowns, and AI-powered portfolio analysis
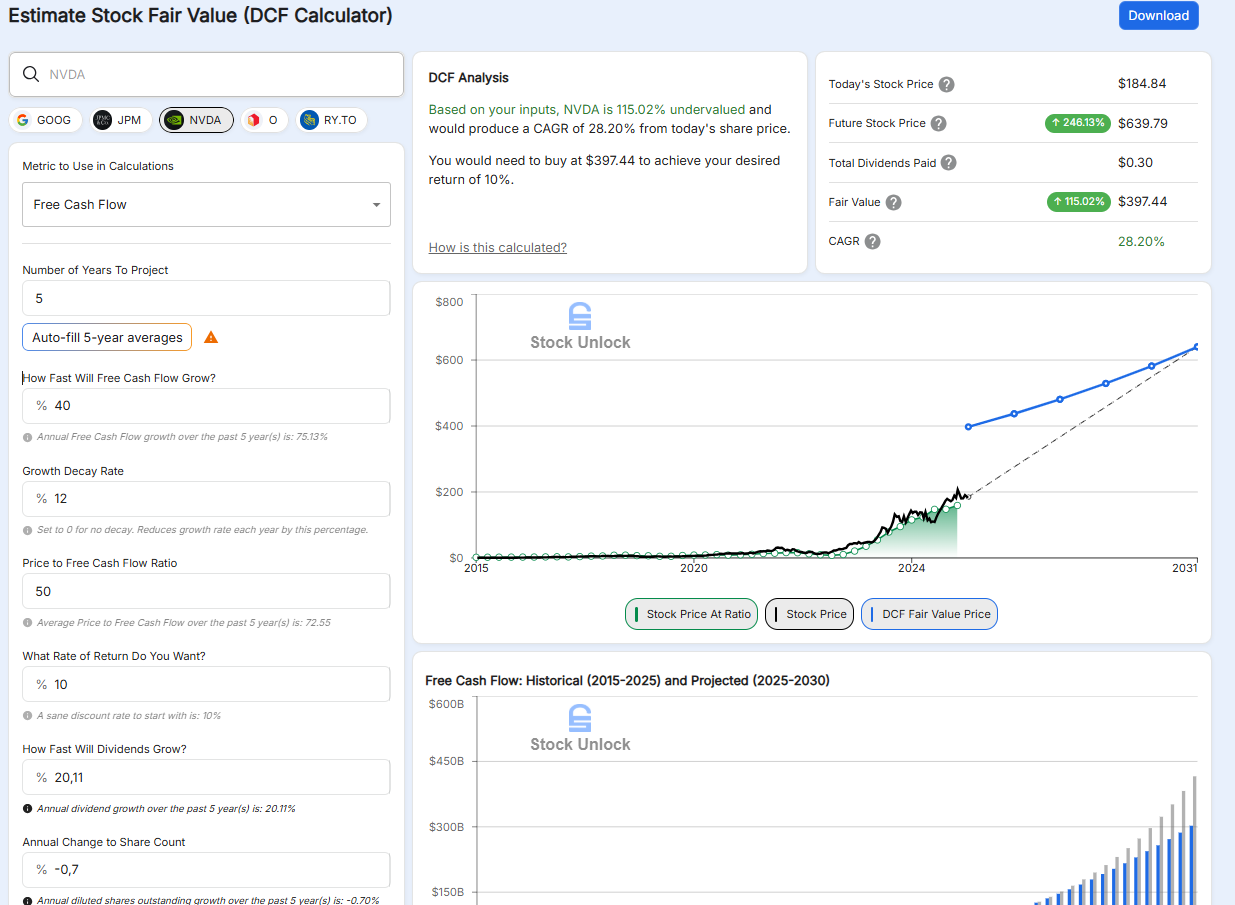
- Stock Price Estimator (DCF): A valuation calculator that auto-fills with historical data, making professional-grade fair value analysis accessible to everyday investors
- Advanced Stock Search: 85+ filters including Stock Scores to screen over 100,000 stocks across 70+ global exchanges
- Dividend Tracking: 35 years of dividend history with growth rates, payout ratios, and income forecasting
- Learn Mode: Integrated education that explains financial concepts throughout the platform
- Stock Comparison: Compare any stocks head-to-head across 80+ metrics
- Native Mobile Apps: Full-featured iOS and Android apps for researching stocks and tracking your portfolio on the go
The platform's philosophy centers on a simple principle: most of your money when investing should go into investing, not expensive software subscriptions.
Why Choose Stock Unlock Over Qualtrim for Complete Investment Analysis
While Qualtrim excels at presenting financial data through charts, Stock Unlock takes a different approach: it provides the complete toolkit investors need while helping them understand what they're looking at. Here's where Stock Unlock provides additional value.
One Platform Instead of Many
Many investors find themselves juggling multiple subscriptions and maintaining messy spreadsheets to cover all their analytical needs. Qualtrim handles data visualization well, but you might need separate tools for portfolio tracking, dividend analysis, stock screening, valuation scoreing, stock comparison, and more.
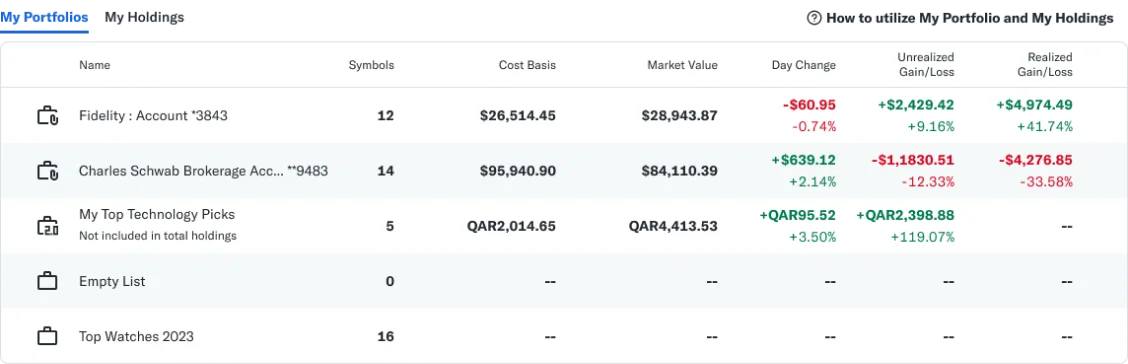
Stock Unlock consolidates these into one platform. The portfolio tracker offers features that put most brokerages to shame: time-weighted returns, multiple return calculation methods, SPY benchmark comparison, dividend income forecasting, diversification charts with geographic heatmaps, and even AI-powered portfolio summaries. You can connect your brokerage directly or add holdings manually, with support for multi-currency portfolios.
For experienced investors who have spent years juggling multiple tools, Stock Unlock offers consolidation and relief. For newer investors, it provides one place to learn and grow without needing to piece together multiple subscriptions.
⚡ Stock Unlock in Action: You're currently paying for a portfolio tracker, a separate screener tool, and keeping dividend projections in a spreadsheet. With Stock Unlock, you connect your brokerage accounts, immediately see your holdings with Stock Scores applied to each position, track your dividend income with 35 years of history per stock, and screen for your next investment, all without switching between apps or updating spreadsheets.
Stock Scores That Actually Work
Qualtrim presents financial metrics through interactive charts, allowing you to draw your own conclusions. This works well for investors who know exactly what to look for. But synthesizing dozens of metrics into an overall assessment takes time and expertise, and many platforms offer scoring systems that use generic, one-size-fits-all algorithms.
Stock Unlock's Stock Scores are different. They're not a cheap single algorithm for every stock because they're a sophisticated system built and battle-tested for years, with algorithms uniquely calibrated for different industries. A healthy tech company looks different from a healthy bank or utility, and Stock Unlock's scoring reflects these nuances.
The scores break down across seven dimensions: Valuation, Growth, Profitability, Dividends, Financial Health, Management, and Analyst. The Valuation breakdown is particularly popular as it shows whether a stock appears cheap or expensive relative to its fundamentals and growth rates, helping you identify potential opportunities without hours of manual analysis.
For experienced investors, the scores save research time. For newer investors, they provide a starting point and teach what matters in fundamental analysis.
⚡ Stock Unlock in Action: You're screening for potential investments and find two companies with similar revenue growth. Rather than comparing each metric individually across multiple chart views, Stock Unlock's Stock Scores show you instantly that Company A scores 4.2/5 with strong marks in Profitability and Financial Health, while Company B scores 2.6/5 with concerning numbers in the Management dimension. You've identified which company warrants deeper research in seconds rather than minutes.
Learn Mode: Understand the "Why" Behind Every Metric
Qualtrim presents financial metrics clearly, which is excellent for investors who already understand what they're looking at. But many investors, especially those just starting out, don't have the background to fully interpret what those metrics mean.
Stock Unlock's Learn Mode acts like training wheels on a bicycle. When activated, helpful pop-ups appear throughout the platform defining terms and explaining concepts. When you're analyzing a company's debt-to-equity ratio and want to understand what "good" looks like, the explanation is one click away without leaving the page.
This is not just a glossary tucked away in a help section. It is contextual education integrated directly into your research workflow. The platform opens a door to investing knowledge that's been traditionally gatekept, walking users through complex financial concepts without requiring another degree.
For experienced investors, Learn Mode toggles off instantly for a cleaner interface.
⚡ Stock Unlock in Action: You're analyzing a potential investment and notice the company has a high Price-to-Free-Cash-Flow ratio. With Learn Mode active, you click the question mark and instantly see an explanation: what the ratio measures, how it compares to other valuation metrics, and what a high or low number might indicate about investor expectations. Instead of switching to a separate browser tab to research, you continue your analysis with the context you need right there.
Stock Price Estimator: Professional Valuation Made Accessible
Qualtrim offers a DCF calculator, and Stock Unlock does too, but Stock Unlock's approach emphasizes accessibility without sacrificing power. The calculator auto-fills required fields with historical data, providing a sensible starting point from which you can tweak and adjust inputs.
As one independent reviewer noted: "This gives you an easy to use calculator which literally unlocks one of the biggest mysteries every investor asks at some point: what is a fair price for this stock? I'm not aware of any other tool that's brought this to everyday average investors."
The integrated tutorial videos and wizards make Stock Unlock's DCF accessible to beginners while remaining powerful enough for experienced investors who want to model different scenarios.
Global Coverage and Data Depth
Qualtrim provides over 30 years of financial history for its covered companies. Stock Unlock extends this further with up to 35 years of historical data on premium plans, covering over 170,000 stocks and ETFs across 70+ global exchanges including NYSE, NASDAQ, TSX, LSE, Tokyo, and Frankfurt.
This global coverage is particularly valuable for investors building internationally diversified portfolios. The platform standardizes all financial data according to GAAP standards, ensuring consistency when comparing companies across different markets and accounting frameworks.
Stock Unlock was built partly because the founders found that many other sites, including Yahoo Finance, have numerous data errors. Their data comes from Finnhub, a leading provider of institutional-grade financial data, with segment-level KPI data from Fiscal AI.
🏅 NOTE: We also evaluated alternatives like Simply Wall Street, which offers visual analysis through its Snowflake diagram. While Simply Wall Street provides intuitive infographics, some users have noted that its scoring methodology can feel opaque and its portfolio management tools are less robust than competitors. Stock Unlock's combination of transparent, industry-specific Stock Scores, comprehensive portfolio tracking, and integrated education creates a more complete solution. As one user shared on Product Hunt: "I stopped my subscription of Simply Wall Street because I didn't need it anymore. Now I don't know what I would do without Stock Unlock."
Stock Unlock Pricing
Stock Unlock operates on a freemium model with three tiers designed for different investor needs. The pricing philosophy is simple: most of your money should be going into investing, not expensive software subscriptions.
Free Plan ($0)
- Limited financial and dividend data
- Unlimited watchlists
- 2 manual portfolios
- Limited Stock Scores
- Limited DCF calculator access
- 3 screener searches per week
- 15-day free brokerage connection, no credit card required
Pro Plan ($9/month or $90/year)
- 10 years of financial and dividend data
- 1 linked brokerage, unlimited manual portfolios
- Unlimited Stock Scores
- Full DCF calculator
- Unlimited screener results and filters
- Portfolio notifications
Unlimited Plan ($24/month or $240/year)
- 35 years of financial and dividend data
- Unlimited linked brokers
- All Pro features plus unlimited Key Business Metrics
- Access to all current and future features
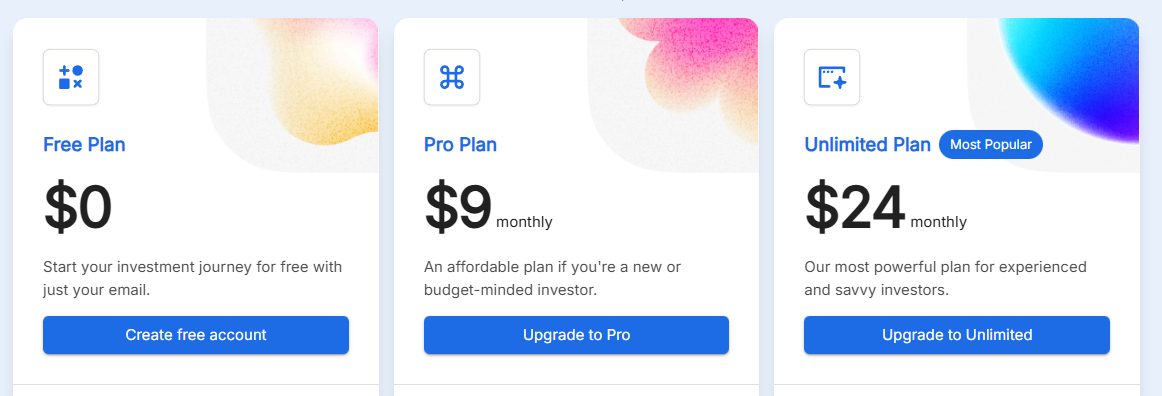
At $9/month for Pro (or $7.50/month billed annually), Stock Unlock actually costs less than Qualtrim's $9.99/month while covering portfolio tracking, screening, dividends, DCF, and education in a single subscription. There's also a generous free tier with no credit card required.
All paid plans include a 30-day money-back guarantee, allowing you to test the full feature set without risk. The free tier provides substantial value so you can explore the entire site, crawl through any stock, and use every feature without creating an account or entering a credit card.
Who Should Use Stock Unlock?
Choose Stock Unlock if:
- You're tired of juggling multiple tools and spreadsheets. Stock Unlock consolidates portfolio tracking, stock screening, dividend analysis, and valuation tools into one platform. Experienced investors find relief; newer investors get everything they need in one place.
- You want scores that account for industry differences. Stock Unlock's Stock Scores aren't generic calculations. They're calibrated for different sectors, providing more meaningful assessments of whether a company's fundamentals are genuinely strong relative to its peers.
- You believe most of your money should go into investing. At $9/month for the Pro plan (or free to start), Stock Unlock delivers professional-grade tools without the premium price tag. The founders built this platform because they were frustrated with cash-grab pricing in the industry.
- You want to learn while you analyze. Whether you're new to investing or want a refresher on specific concepts, Learn Mode provides contextual education throughout your research workflow.
- You invest globally and want consistent data standards. With coverage of 170,000+ stocks across 70+ exchanges and GAAP-standardized financials, Stock Unlock supports international portfolio building with reliable, comparable data.
Stock Unlock combines portfolio tracking, stock screening, dividend analysis, a DCF calculator, and contextual education in one platform, starting at $0. Create a free account to get started. No credit card required.
2. Seeking Alpha: Best Alternative for Community-Powered Investment Research
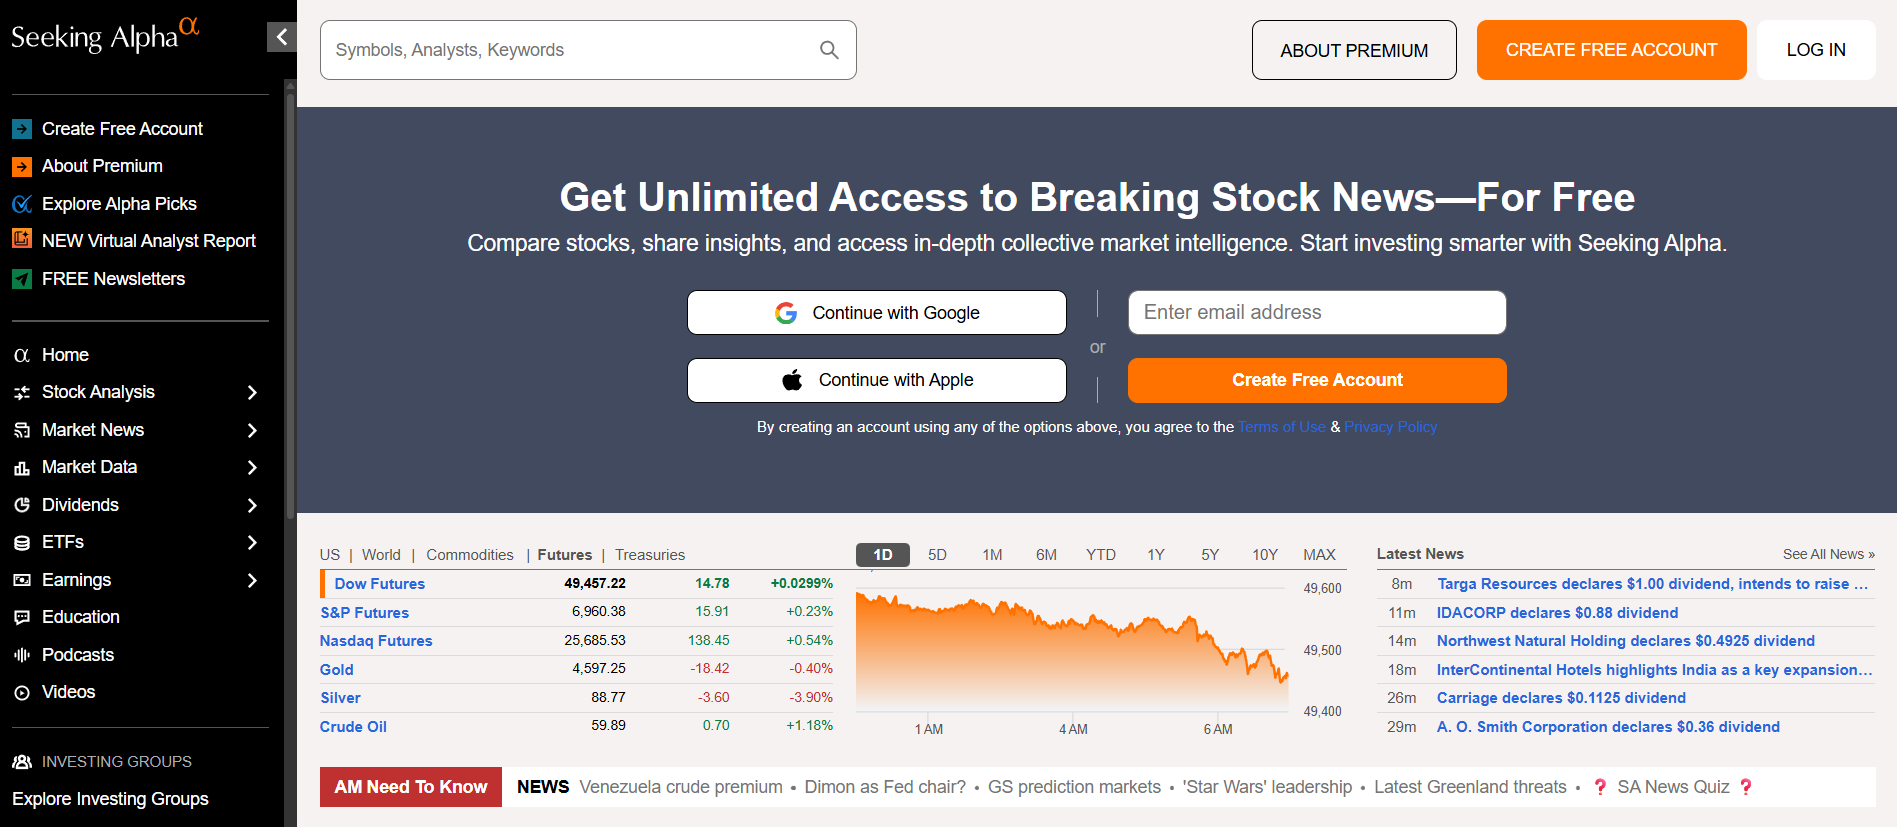
Seeking Alpha is a crowdsourced investment research platform that provides something Qualtrim doesn't emphasize: diverse human perspectives on stocks. With over 7,000 independent contributors publishing approximately 400 articles and news updates daily, the platform serves investors who want to stress-test their ideas against multiple viewpoints. Its key capabilities include:
- Community Research Library: Thousands of investment analysis articles monthly from professional analysts, individual investors, and financial journalists
- Quant Ratings System: Proprietary algorithmic ratings analyzing 100+ metrics across five factors (Value, Growth, Profitability, Momentum, EPS Revisions)
- Portfolio Tracker: Brokerage integration with "Portfolio Health Score" aggregating ratings across holdings
- Dividend Grades: Letter grades (A+ to F) across Safety, Growth, Yield, and Consistency dimensions
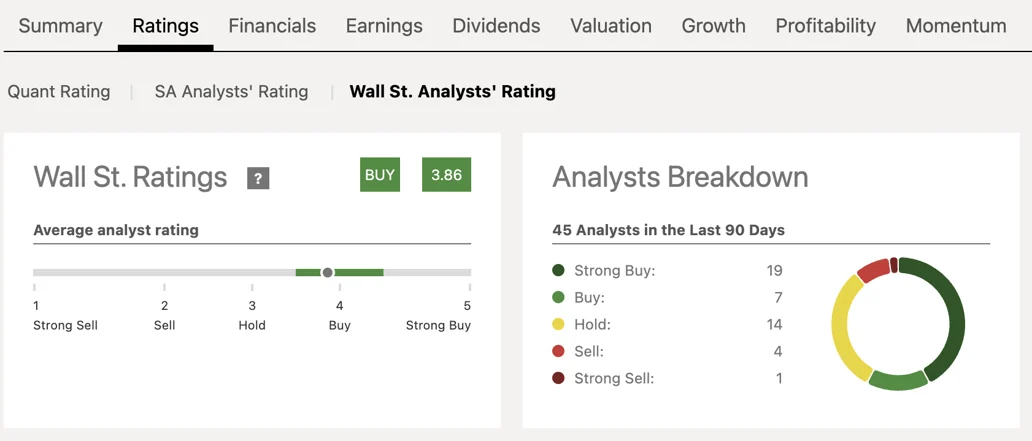
- Wall Street Analyst Ratings: Aggregated consensus from sell-side analysts with price targets
Why Choose Seeking Alpha Over Qualtrim for Community-Powered Research
Seeking Alpha stands out compared with Qualtrim in several distinct ways:
-
Human Analysis and Investment Theses
Qualtrim focuses on data visualization without community content. Seeking Alpha takes the opposite approach: its core product is human analysis. Subscribers access thousands of detailed research articles presenting complete investment theses, explaining the "why" behind recommendations, and analyzing competitive positioning and strategic direction that pure financial data cannot capture. For investors who want to understand the qualitative narrative behind the numbers, Seeking Alpha provides this contextual layer.
-
Community Discussion and Peer Review
Each Seeking Alpha article features active comments where readers engage with authors and each other. This community functions as peer review, with commenters challenging assumptions and pointing out errors. Qualtrim's community interaction is available through a separate Discord server, not integrated into the analysis platform.
-
Multiple Rating Systems for Cross-Validation
Seeking Alpha provides three distinct rating perspectives: algorithmic Quant Ratings, aggregated SA Author Ratings, and Wall Street Analyst Ratings. This triangulation allows investors to identify when different analytical approaches agree or diverge on a security.
Source: Seeking Alpha
🏅 NOTE: We also evaluated Morningstar and Motley Fool for this category. While Morningstar offers institutional-quality in-house research with their star rating system, and Motley Fool provides actionable stock recommendations, Seeking Alpha offers the most comprehensive community-powered ecosystem combining diverse perspectives with quantitative ratings.
Seeking Alpha Pricing
- Basic (Free): Limited article access, real-time quotes, basic portfolio tracking
- Premium ($299/year): Unlimited articles, full Quant Ratings, advanced screeners, brokerage linking
- PRO ($2,400/year): All Premium features plus exclusive "Top Ideas," Short Ideas Portal, real-time alerts
- Alpha Picks ($499/year): Two "Strong Buy" picks monthly with detailed research reports
Seeking Alpha's subscription auto-renews annually, which has been a common point of feedback in user reviews.
Considerations
Seeking Alpha's community model means article quality varies significantly by contributor. Premium at $299/year represents a meaningful investment, and the platform focuses primarily on US equities. There is no built-in DCF calculator, so investors who want valuation scoreing tools alongside community research may need to pair Seeking Alpha with additional platforms.
Who Should Use Seeking Alpha?
Choose Seeking Alpha if:
- You value qualitative analysis alongside raw data. If you want to understand the narrative behind why a stock might be undervalued, including competitive dynamics and strategic direction, Seeking Alpha's contributors provide this qualitative layer.
- You benefit from community discussion and stress-testing ideas. The active comments sections function as peer review, exposing blind spots and challenging assumptions in ways that solitary data analysis cannot.
- You want multiple rating perspectives for cross-validation. The three-pronged rating system (Quant, SA Author, Wall Street) helps identify when different analytical approaches agree or diverge.
Learn more about Seeking Alpha's community research model.
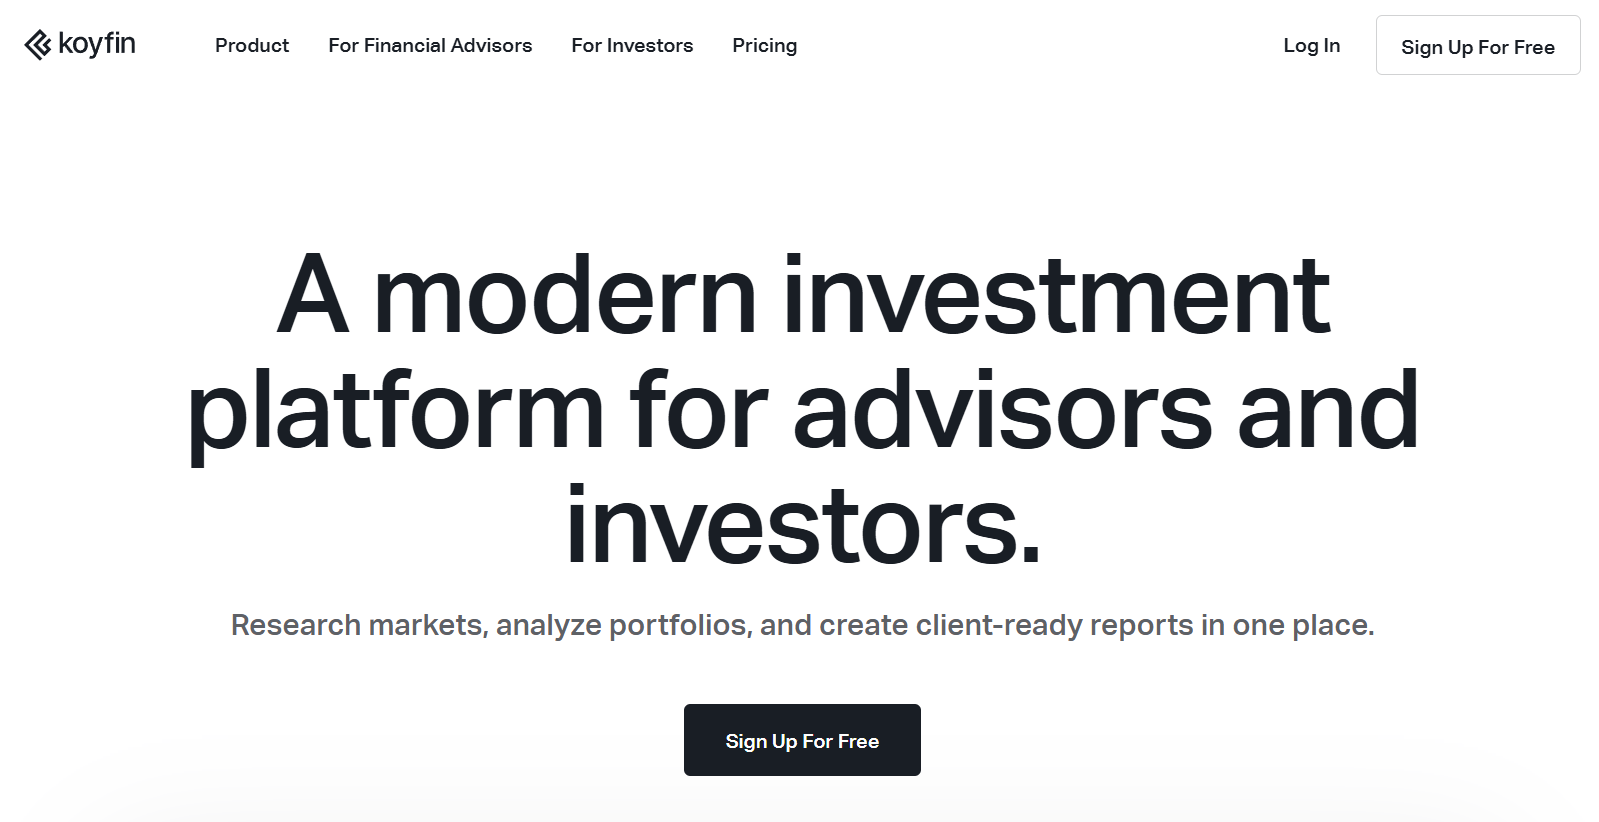
3. Koyfin: Best Alternative for Enterprise-Grade Professional Analytics
Koyfin is an institutional-grade financial analytics platform that functions as a "Bloomberg for the rest of us." Founded by former Wall Street professionals with backgrounds at Goldman Sachs and various hedge funds, it targets investors who have outgrown simpler platforms and need professional-level capabilities. Its key features include:
- Bloomberg-Style Dashboards: Drag-and-drop customizable workspaces with linked widgets that update dynamically
- S&P Capital IQ Data: Institutional-grade data from a leading financial data provider
- Multi-Asset Coverage: 100,000+ global securities across equities, ETFs, bonds, currencies, and commodities
- Advanced Charting: 100+ technical and fundamental indicators with the ability to overlay financial data on price charts
- Financial Advisor Tools: Model portfolio construction, client reporting, and custodian integrations
Why Choose Koyfin Over Qualtrim for Professional Analytics
Koyfin stands out compared with Qualtrim in several fundamental ways:
-
Multi-Asset Class Coverage
Qualtrim is built around stock and dividend analysis. Koyfin offers comprehensive data across bonds (live yields from 45 countries), foreign exchange (60+ currency pairs), commodities, and economic indicators. For investors who need to understand how macro factors affect their equity portfolios, Koyfin provides integrated tools that Qualtrim doesn't offer.
-
Institutional-Grade Customization
Koyfin embraces the depth of customization professional users require. The dashboard system supports unlimited custom layouts with linked widgets, saved views, chart templates, and custom formula columns. This level of workflow customization mirrors institutional terminal capabilities.
-
Financial Advisor Infrastructure
Qualtrim doesn't appear to offer dedicated financial advisor features. Koyfin's Advisor tiers provide model portfolio construction, client reporting with custom branding, and direct custodian integrations (Schwab, Fidelity, Interactive Brokers). For RIAs managing client assets, Koyfin offers integrated practice management.
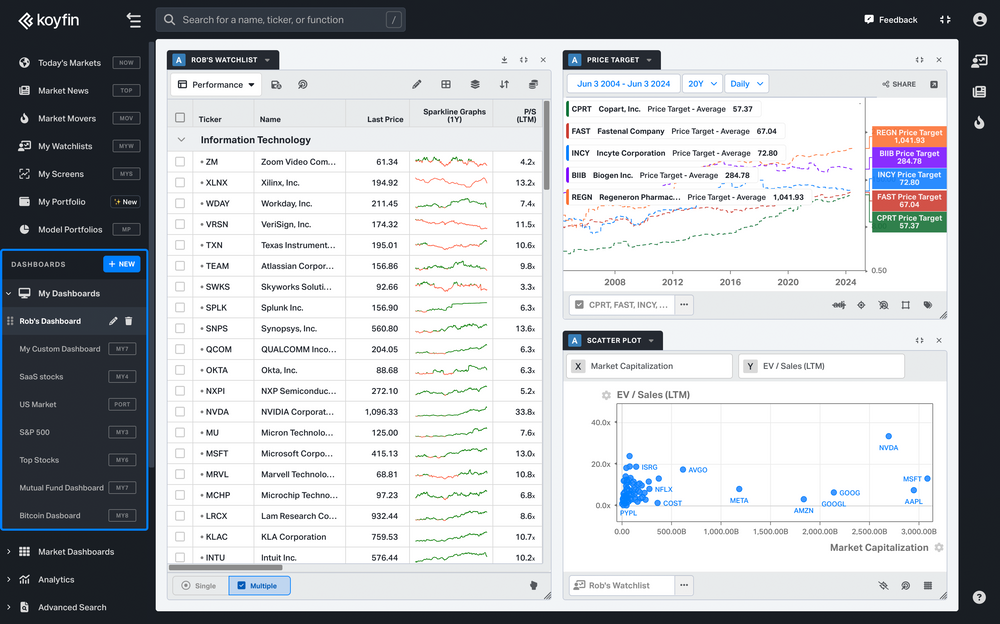
Source: Koyfin
🏅 NOTE: We also evaluated FactSet and YCharts. While FactSet offers deeper fixed-income analytics at $12,000+/year, and YCharts provides a simpler interface for advisors, Koyfin offers the best balance of institutional-grade capabilities and accessible pricing ($39-299/month), earning a 9/10 rating from the Kitces Report.
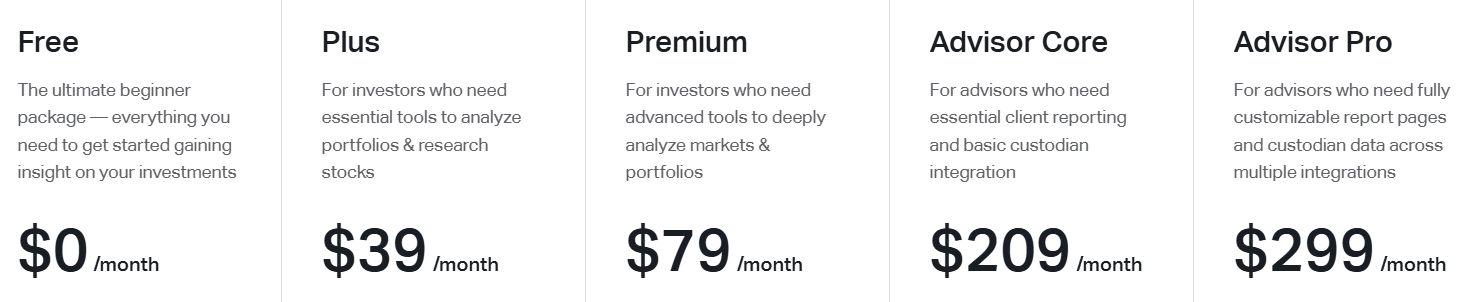
Koyfin Pricing
- Free ($0): 2 years of financials, 2 watchlists, advanced charting
- Plus ($39/month): 10 years of data, unlimited watchlists and dashboards, full screener
- Premium ($79/month): 10 years of data, advanced portfolio analytics, custom formulas
- Advisor Core ($209/month): Model portfolios, client reporting, 1 custodian integration
- Advisor Pro ($299/month): Multiple custodian integrations, custom report pages, priority support
Considerations
Koyfin is popular with financial advisors and institutional analysts, which means the interface can feel complex for everyday investors. The Plus plan starts at $39/month, making it one of the more expensive options for retail use. Individual investors cannot connect brokerages for automatic portfolio syncing (this feature is reserved for advisor-tier plans), and the platform does not offer a built-in DCF calculator or educational features explaining what the data means. For investors who need powerful analytics without the institutional price tag, other alternatives on this list may offer better value.
Who Should Use Koyfin?
Choose Koyfin if:
- You're a financial advisor or RIA needing model portfolio construction, client reporting, and custodian integrations
- You require multi-asset analysis beyond equities, including bonds, currencies, and macro indicators
- You want Bloomberg-style workflows with deep customization at accessible pricing
See Koyfin's pricing and features.
4. Simply Wall Street: Best Alternative for Infographic-Style Visual Analysis
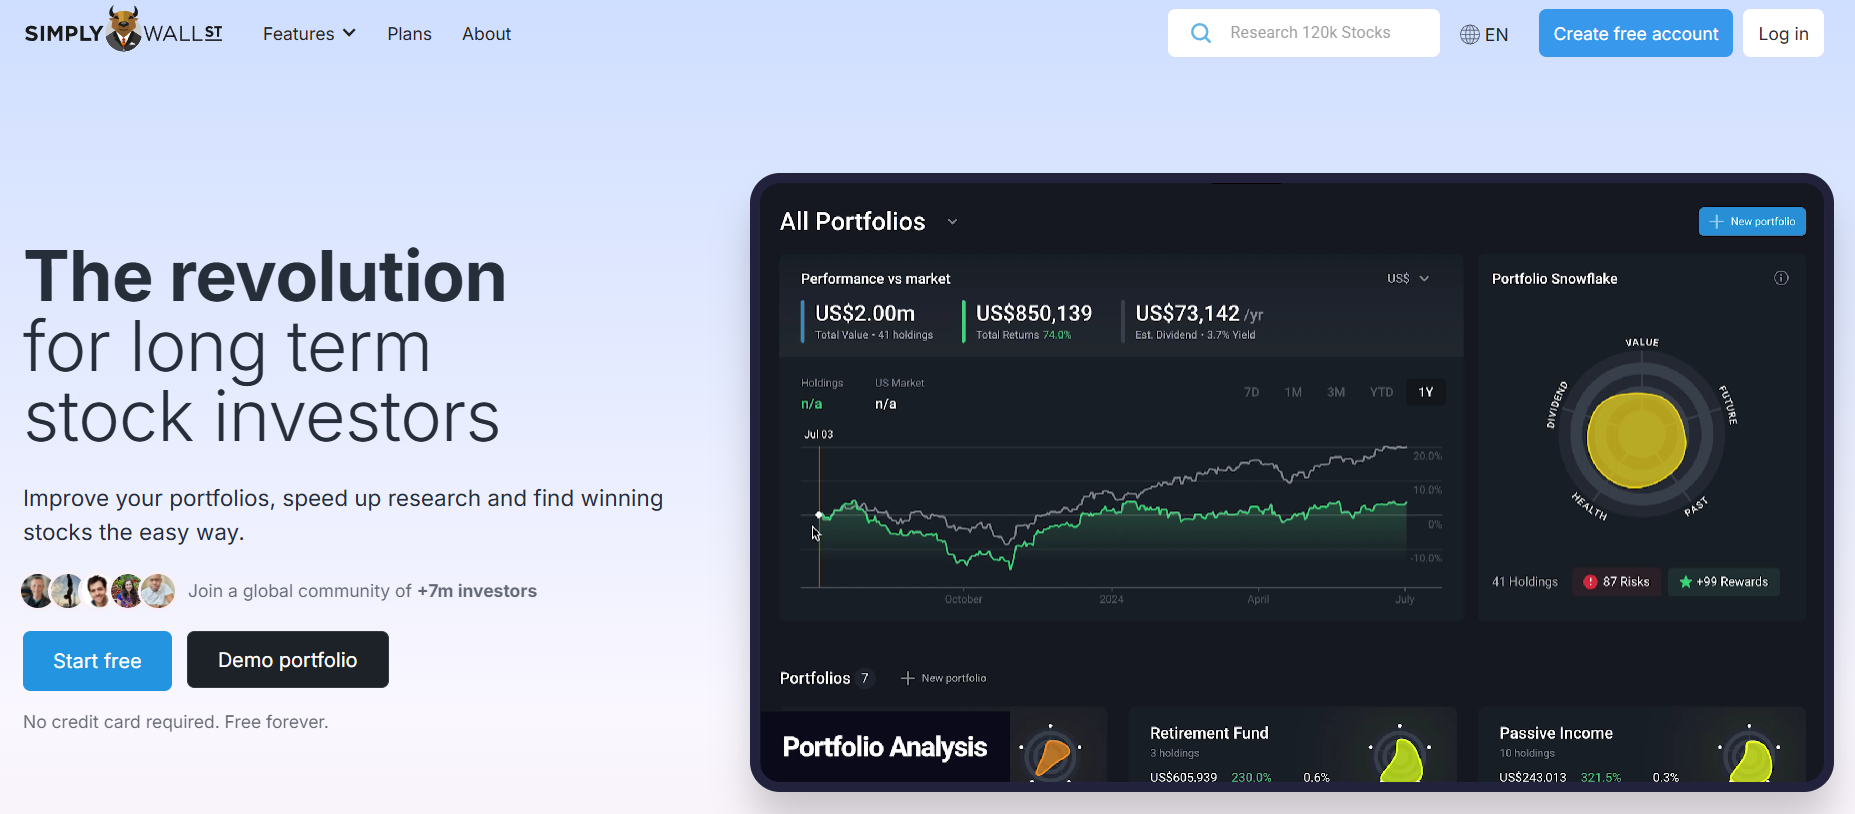
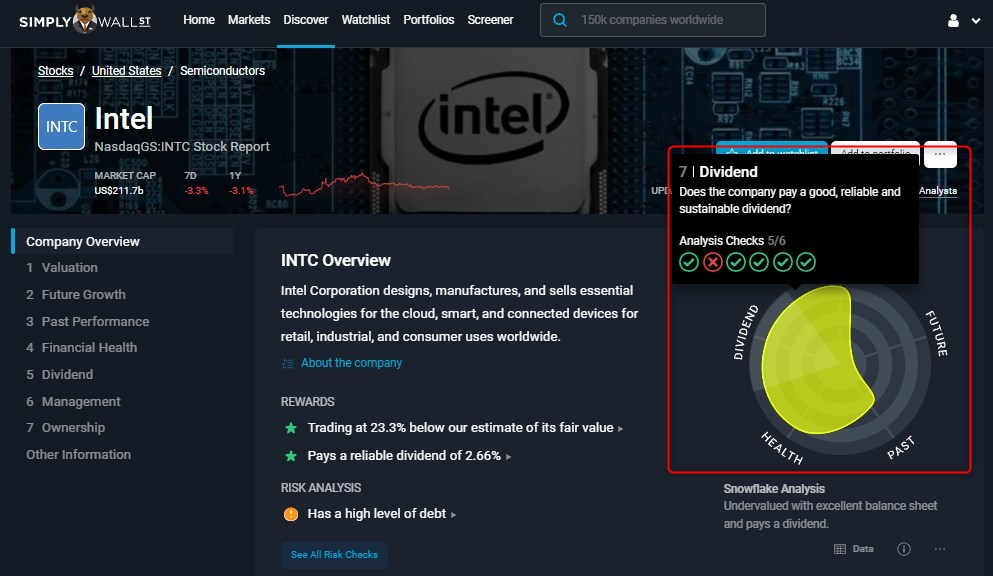
Simply Wall Street takes a fundamentally different approach to data visualization than Qualtrim's chart-based interface. Founded in 2014 in Sydney, the platform has grown to over 7 million registered users by transforming complex financial data into intuitive infographics, most notably their signature "Snowflake" analysis. Its key capabilities include:
- Snowflake Analysis: A radial diagram displaying 5 assessment criteria with 30 underlying automated checks (valuation, future growth, past performance, financial health, dividends)
- Visual-First Design: Infographic-heavy presentation including Sankey diagrams, color-coded health checks, and consistent visual templates
- S&P Global Data: Financial data sourced from institutional-grade S&P Global Market Intelligence
- Community Narratives: User-generated investment theses and fair value estimates alongside automated analysis
- Global Coverage: Analysis on 120,000+ stocks across international markets
Why Choose Simply Wall Street Over Qualtrim for Visual Analysis
Simply Wall Street stands out compared with Qualtrim in several ways:
-
Snowflake Provides Instant Pattern Recognition
Qualtrim presents metrics through interactive charts requiring synthesis across multiple views. Simply Wall Street's Snowflake does this synthesis visually: a large, evenly extended green snowflake signals quality across all dimensions, while a small, lopsided red shape reveals specific weaknesses instantly. Each axis represents six checks, enabling quick scanning of dozens of potential investments based purely on shape and color.
-
Community Narratives Add Qualitative Context
While Qualtrim focuses on data rather than community features, Simply Wall Street's Narratives feature allows users to create and share investment theses with their own fair value estimates. This provides human reasoning alongside automated analysis, offering a hybrid approach between pure data and community perspectives.
-
Established Platform with Institutional Data
With a decade of operation and S&P Global Market Intelligence as its data source, Simply Wall Street offers platform stability and data provenance. The standardized Snowflake methodology applies identical checks to every company regardless of geography, enabling true cross-market comparisons.
Source: Simply Wall Street
Considerations: Some users have noted that Simply Wall Street's scoring methodology can feel opaque, and its portfolio management features are less robust than competitors. The platform also uses auto-renewal billing, which some users have found difficult to manage. If you need comprehensive portfolio tracking alongside visual analysis, you may want to evaluate alternatives like Stock Unlock that combine both strengths.
🏅 NOTE: We also evaluated Yahoo Finance and Stock Rover. While Yahoo Finance offers free basic data without visual sophistication, and Stock Rover provides powerful screening with a steeper learning curve, Simply Wall Street offers the most intuitive visual analysis for investors who process information through diagrams rather than charts.
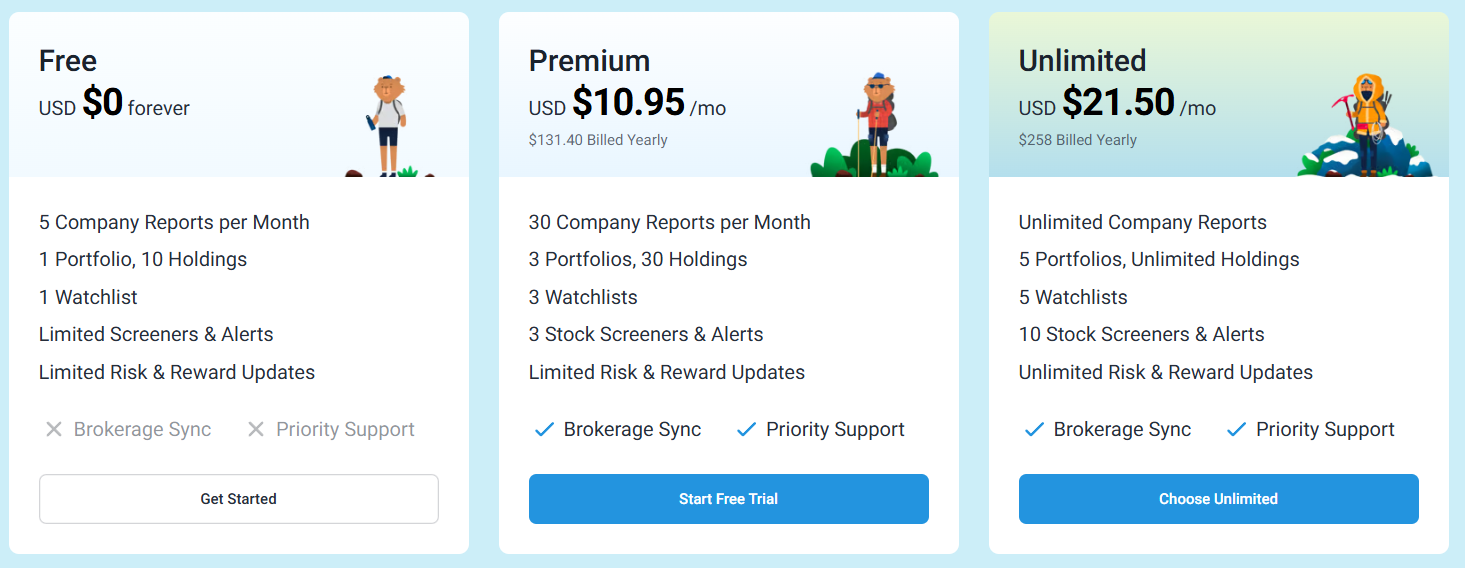
Simply Wall Street Pricing
- Free ($0): 5 company reports/month, 1 portfolio (10 holdings), limited screener
- Premium (~$10/month annual): 30 reports/month, 3 portfolios, brokerage sync
- Unlimited ($21.50/month annual): Unlimited reports, 5 portfolios, full screener access, Excel export
Who Should Use Simply Wall Street?
Choose Simply Wall Street if:
- You process information best through visuals. If charts don't "click" but diagrams and infographics do, the Snowflake provides instant pattern recognition.
- You want community perspectives alongside automated data. The Narratives feature offers human investment theses without requiring a full community-content platform.
- You invest globally and want consistent visual analysis. The standardized Snowflake methodology enables cross-market comparisons regardless of exchange or currency.
Learn more about Simply Wall Street's visual analysis approach.
5. Snowball Analytics: Best Alternative for Dividend Safety and Income Forecasting
Snowball Analytics occupies a distinct niche as a dividend-focused platform rather than a general stock analysis tool. While Qualtrim offers dividend tracking as part of its broader feature set, Snowball Analytics treats dividend and passive income analysis as its core purpose. Its key capabilities include:
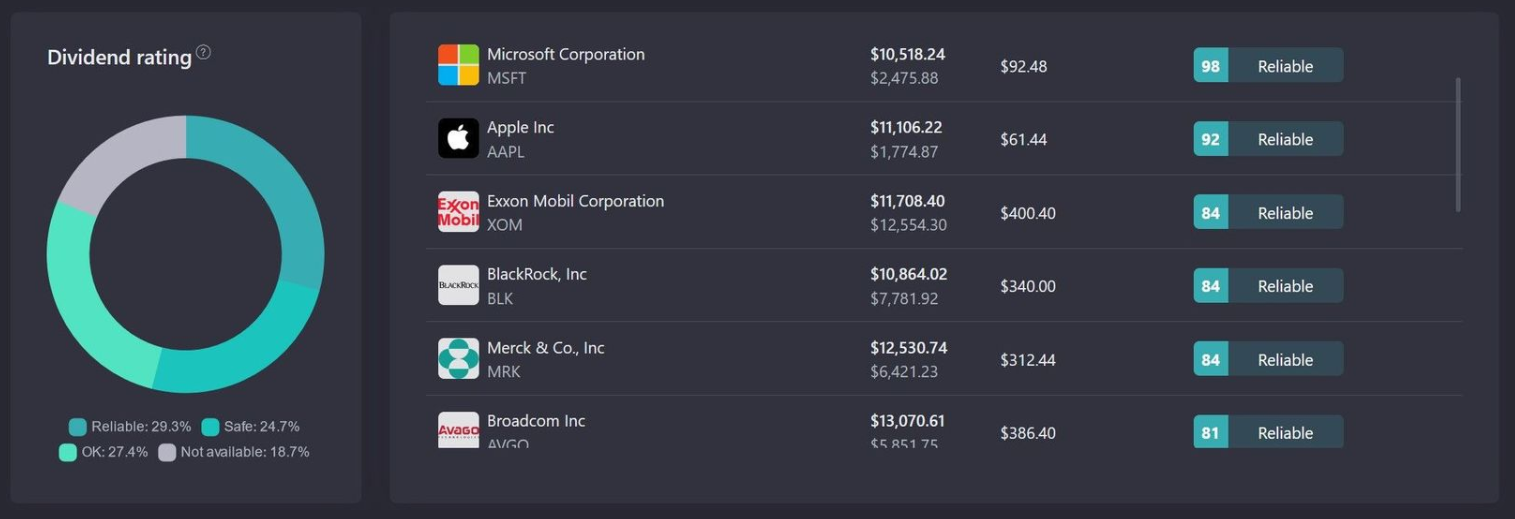
- Dividend Rating System: Proprietary assessment analyzing 13 financial parameters to evaluate dividend safety and sustainability
- Income Forecasting: Multi-year dividend projections for retirement planning
- Comprehensive Yield Calculations: Dividend yield, yield on cost, and three-year growth trajectories
- 1,000+ Broker Integrations: Automatic syncing via multiple third-party providers across U.S., Europe, UK, and Asia
- Rebalancing Calculator: Actionable suggestions for which assets to buy or sell based on target allocations
Why Choose Snowball Analytics Over Qualtrim for Dividend-Focused Investing
Snowball Analytics stands out compared with Qualtrim in several ways:
-
Proprietary Dividend Safety Assessment
Many platforms show dividend yields, payment dates, and basic projections. Snowball Analytics goes further with its Dividend Rating system evaluating 13 parameters including payout ratios, financial health metrics, and dividend history to assess whether companies can maintain their dividends. This safety-first framework helps income investors avoid dividend cuts.
-
International Broker Coverage
Snowball Analytics specifically emphasizes international coverage with 1,000+ supported brokers across multiple continents through multiple third-party providers including Yodlee, SnapTrade, and Plaid. For European investors or Americans with international holdings, this broader aggregation proves practical.
-
Goal Planning with Income Targets
Snowball Analytics allows setting goals around passive income targets (e.g., "generate $50,000 annually in dividends") rather than just portfolio value. The platform projects when users will achieve these goals based on current holdings and contribution rates.
Source: Snowball Analytics
🏅 NOTE: We also evaluated DivTracker and Sharesight. While DivTracker offers simplicity for basic monitoring, and Sharesight provides strong tax reporting (particularly for Australian investors), Snowball Analytics offers the most comprehensive dividend safety analysis. That said, if you want dividend analysis combined with broader portfolio tracking and stock scoring, Stock Unlock offers 35 years of dividend history, dividend scores, income forecasting, and comprehensive portfolio tracking in one platform, making it worth evaluating if you need more than just dividend-focused tools.
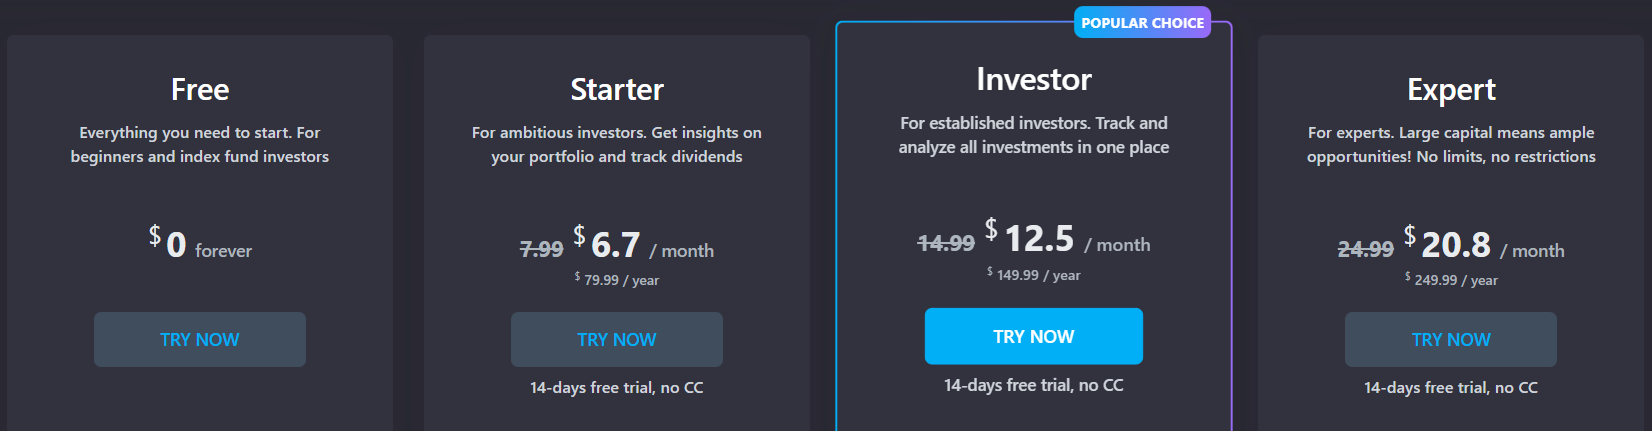
Snowball Analytics Pricing
- Free ($0): 1 portfolio (10 holdings), basic dividend calendar, 5 years company data
- Starter: Unlimited holdings, brokerage linking, dividend ratings
- Investor: 10 portfolios, 10 years data, 30+ years backtesting
- Expert: Unlimited portfolios, 20 watchlists, priority support
Considerations
Snowball Analytics excels at dividend tracking but is narrower in scope than a full analysis platform. The stock screener is limited to dividend stocks with results capped at 5 to 50 results depending on your plan, and there is no DCF calculator. The free tier limits you to 1 portfolio with 10 holdings. For dividend investors who also want comprehensive stock analysis and screening capabilities, a broader platform may complement or replace Snowball.
Who Should Use Snowball Analytics?
Choose Snowball Analytics if:
- Dividend safety is your primary concern. The 13-parameter Dividend Rating provides analysis depth that general platforms don't emphasize.
- You need international brokerage aggregation. The 1,000+ broker coverage supports investors with accounts across multiple countries.
- Your goals center on passive income targets. The income-focused planning framework aligns with how dividend investors think about financial independence.
Learn more about Snowball Analytics' dividend tracking tools.
6. Yahoo Finance: Best Alternative for Zero-Cost Investment Research
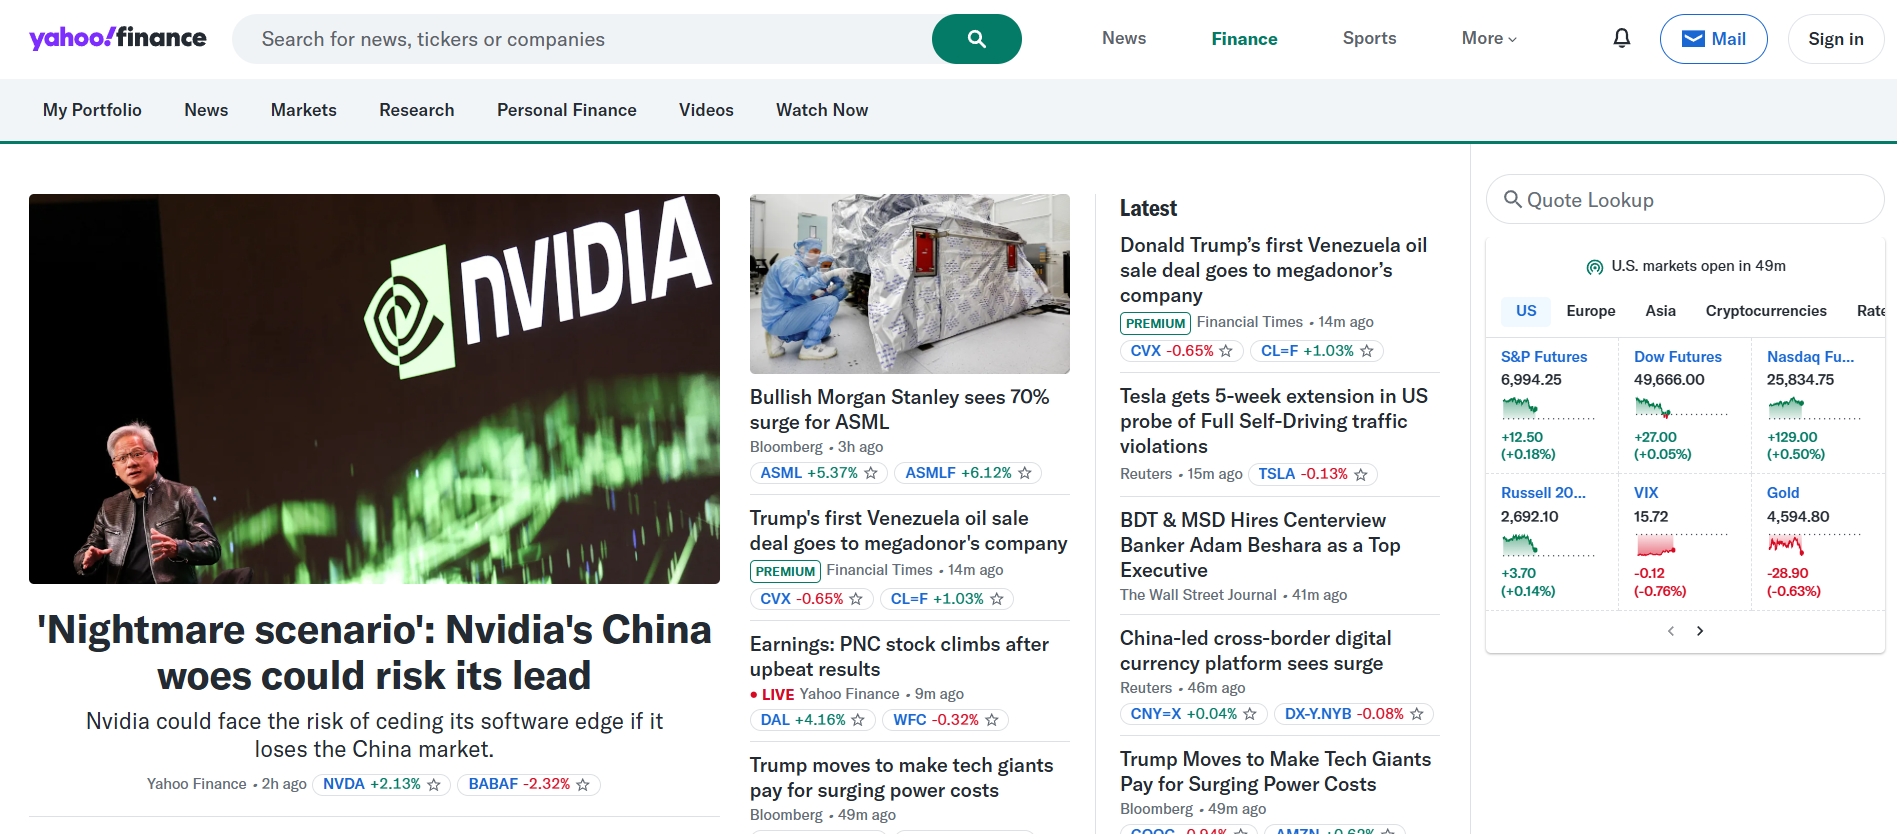
Yahoo Finance represents the ubiquitous baseline for financial information, serving approximately 150 million monthly active users as the world's number one finance website. While some alternatives require paid subscriptions, Yahoo Finance provides genuinely useful research tools completely free. Its capabilities include:
- Free Core Functionality: Real-time quotes, historical data, financial statements, and portfolio tracking at zero cost
- Stock Screener: Dozens of predefined criteria covering fundamentals and technicals
- News Aggregation: Content from Reuters, Associated Press, Bloomberg, plus eight hours of daily live market coverage
- 150 Million Users: Established since 1997 with nearly three decades of continuous operation
- Conversations Feature: Community comments on each stock page for gauging retail sentiment
Why Choose Yahoo Finance Over Qualtrim for Zero-Cost Research
Yahoo Finance presents a compelling alternative for investors whose primary criterion is avoiding subscription costs:
-
Completely Free Core Functionality
Qualtrim costs $9.99/month, which (while affordable) represents a recurring commitment. Yahoo Finance provides stock quotes, historical data, financial statements, portfolio tracking, and screening capabilities completely free. This isn't a limited trial; it's the permanent free experience.
-
Established Brand Recognition
Yahoo Finance launched in 1997 and has operated continuously for nearly three decades. For investors who value platform longevity, this track record provides confidence that newer platforms don't yet match.
-
News Aggregation and Editorial Content
Yahoo Finance synthesizes content from major financial outlets plus original editorial content and eight hours of daily live coverage. Qualtrim focuses on data rather than editorial content, which is a different philosophy.
Source: Yahoo Finance
Considerations: Stock Unlock was built partly because the founders found that Yahoo Finance and other sites have numerous data errors. If data accuracy is paramount for your investment decisions, you may want to verify critical data with official company filings or use platforms that source from institutional-grade providers.
🏅 NOTE: We also evaluated Google Finance and MarketWatch. While Google Finance offers clean Google ecosystem integration with more limited features, and MarketWatch provides excellent news coverage without comparable portfolio tools, Yahoo Finance offers the most complete free package combining tracking, screening, and news aggregation.
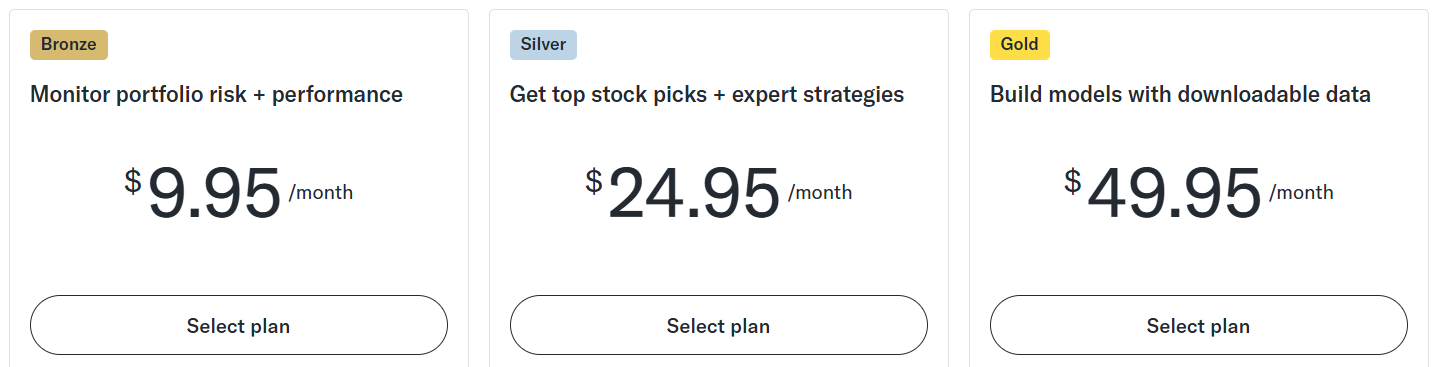
Yahoo Finance Pricing
- Free ($0): Full core functionality including screener, portfolio tracking, news
- Premium Bronze ($9.95/month): Ad-free, advanced portfolio tracking
- Premium Silver ($24.95/month): Morningstar and Argus research reports, Financial Times access
- Premium Gold ($49.95/month): 40+ years historical data, advanced charting, smart screeners, trade ideas
Note that even the paid Bronze tier reduces rather than eliminates ads entirely.
Who Should Use Yahoo Finance?
Choose Yahoo Finance if:
- You want zero financial commitment. The free tier provides genuinely useful tools without requiring a credit card.
- You prioritize established platforms. Nearly three decades of operation and 150 million users provide platform stability confidence.
- You value news aggregation. Diverse perspectives from major outlets complement pure data analysis.
Learn more about Yahoo Finance's free and premium tools.
7. TIKR: Best Alternative for Institutional-Quality Data Access
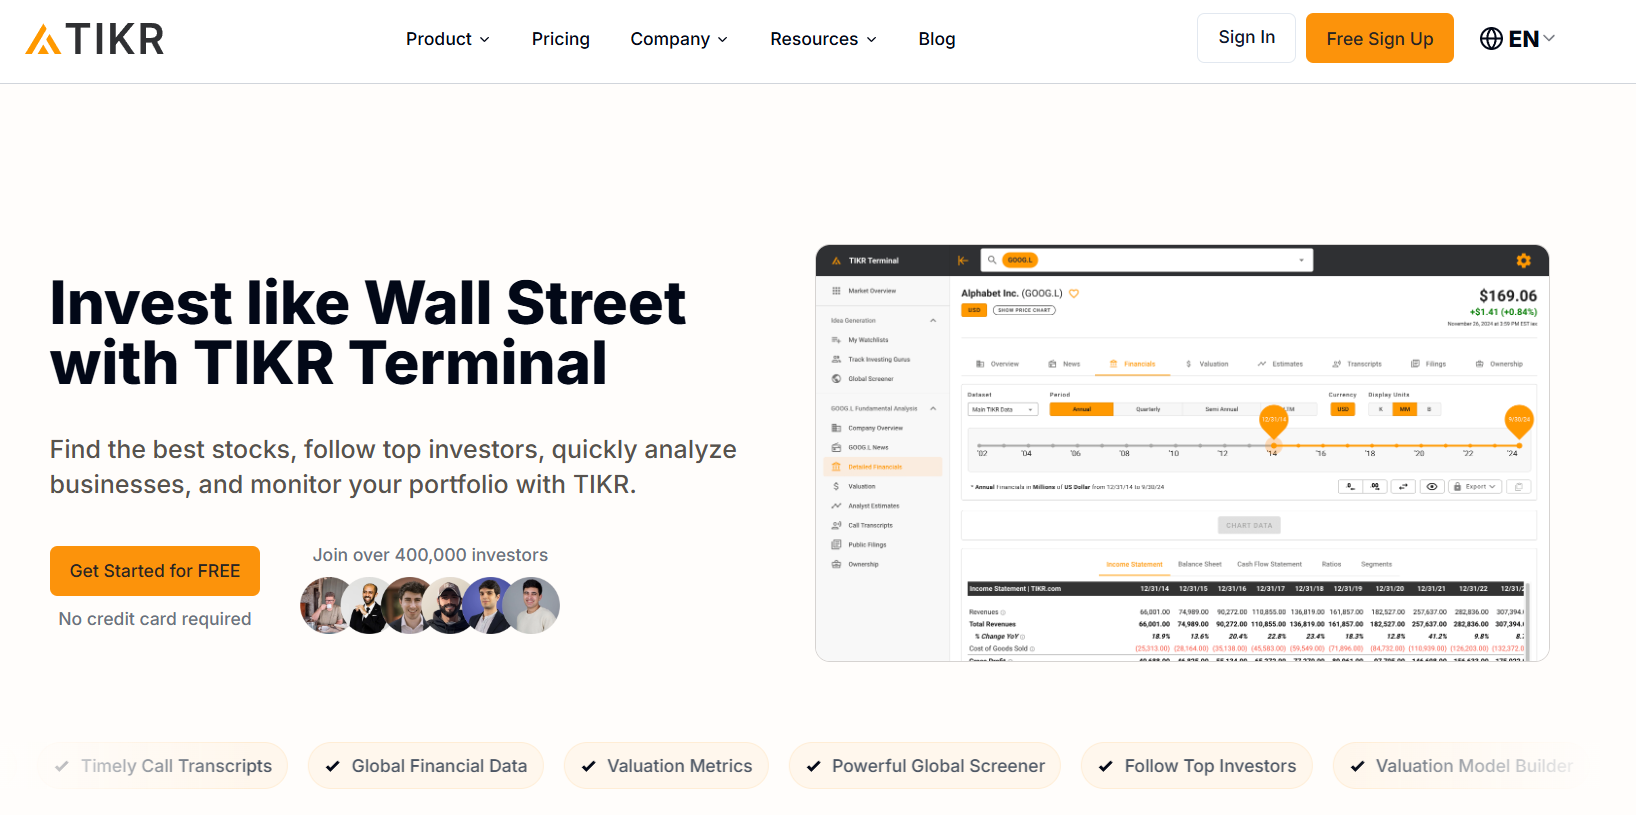
TIKR was founded specifically to democratize access to institutional-grade data. Co-founder Sahil Khetpal built the platform after recognizing the informational disadvantage retail investors faced compared to hedge fund analysts with Bloomberg access. Its key capabilities include:
- S&P Global Capital IQ Data: Institutional-grade data from a leading financial data provider used by professional investors
- 100,000+ Global Stocks: Coverage across 92 countries and 136 exchanges
- 20 Years Financial History: Deep historical data with 40 quarters on Pro plans
- 300+ Screener Parameters: Comprehensive fundamental filters including analyst estimates
- Superinvestor Tracking: Holdings of 10,000+ investment funds including international filings
Note that TIKR is a browser-only platform with no native mobile apps, which may matter for investors who research on the go.
Why Choose TIKR Over Qualtrim for Institutional-Quality Data
TIKR stands out compared with Qualtrim in fundamental ways:
-
S&P Capital IQ Data Sourcing
TIKR sources from S&P Global Capital IQ, the same provider used by many hedge funds and investment banks. This institutional sourcing provides GAAP-standardized financials with consistent formatting across global markets.
-
300+ Fundamental Screener Filters
TIKR's screener offers 300+ parameters spanning valuation, growth, profitability, and analyst estimates with custom criteria input rather than preset ranges. This enables sophisticated quantitative strategies.
-
Superinvestor Portfolio Tracking
TIKR tracks disclosed holdings of 10,000+ investment funds globally, extending beyond U.S. 13F filings to include international disclosures. This capability for observing what sophisticated investors are buying provides unique research opportunities.
Source: TIKR
🏅 NOTE: We also evaluated Ziggma and AlphaSpread. While Ziggma offers similar positioning with less data depth, and AlphaSpread focuses narrowly on intrinsic valuation, TIKR offers the most comprehensive institutional-grade data access for self-directed analysts who prioritize data depth over simplified interfaces.
TIKR Pricing
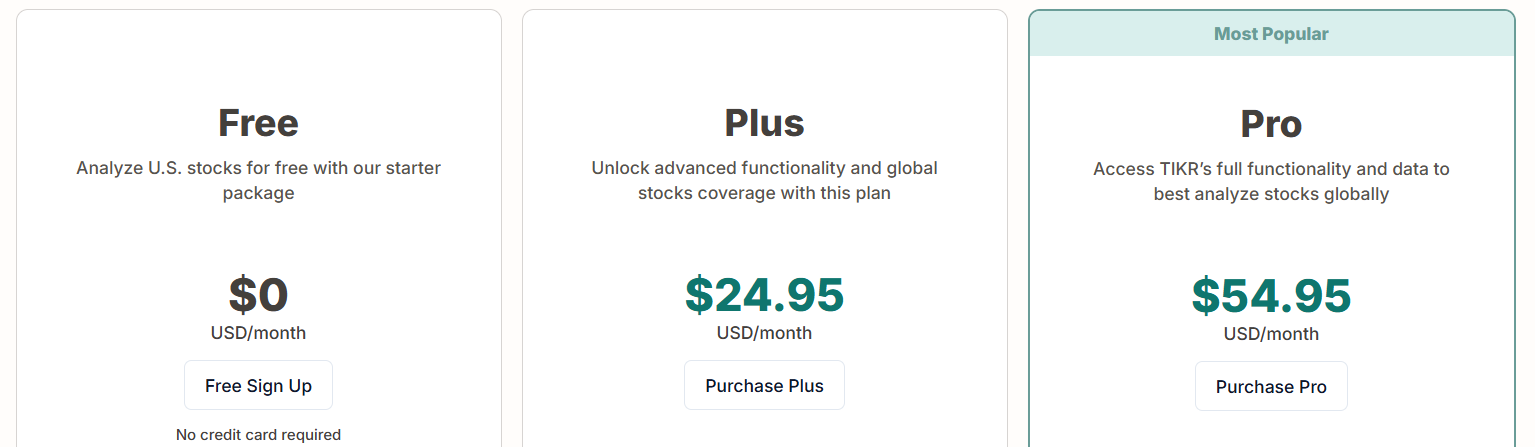
- Free ($0): U.S. stocks only, 3 years history, 1 saved screen
- Plus ($24.95/month): Global coverage, 10 years history, 5 saved screens, top 150 Superinvestors
- Pro ($54.95/month): 20 years history, full transcript search, 10,000+ Superinvestors, Excel export
Considerations
TIKR's depth of data comes with a meaningful learning curve, particularly for beginners who are still building their understanding of financial metrics and ratios. The platform has no built-in educational features and does not offer brokerage-connected portfolio tracking or a native mobile app. The free tier is limited to US stocks with only 3 years of financial history. For investors who want institutional-quality data with more guidance on what it means, pairing TIKR with an educational platform or choosing an all-in-one alternative may be more practical.
Who Should Use TIKR?
Choose TIKR if:
- You want institutionally-sourced financials. TIKR's Capital IQ sourcing provides the same data quality professional investors rely on.
- You execute sophisticated screening strategies. The 300+ parameter screener enables complex quantitative strategies that simpler tools can't accommodate.
- You want Superinvestor portfolio tracking. Observing positions of 10,000+ global funds can generate high-conviction ideas.
Learn more about TIKR's institutional-quality data platform.
The Final Verdict
Qualtrim is a solid option for investors who want clean data visualization at an accessible price. But depending on where you are in your investing journey, you may find that other platforms fill gaps Qualtrim doesn't cover. Here's how the alternatives stack up:
- Stock Unlock for investors who want to consolidate multiple tools into one complete platform, with portfolio tracking, proprietary Stock Scores, and integrated education
- Seeking Alpha for community-powered research with diverse analyst perspectives and multiple rating systems
- Koyfin for enterprise-grade analytics with multi-asset coverage and financial advisor tools
- Simply Wall Street for visual learners who prefer infographic-style analysis through the Snowflake diagram
- Snowball Analytics for dividend-focused investors prioritizing income safety and payment sustainability
- Yahoo Finance for zero-cost research with established platform stability
- TIKR for institutional-quality data access from S&P Capital IQ sources
The best approach depends on your needs. Some investors combine multiple specialized tools, though platforms like Stock Unlock aim to consolidate those capabilities so you don't have to. Consider your specific needs, learning style, and investment goals when deciding which solutions work best for you.
Whether you choose one platform or several, the goal is the same: spend less time on tools and more time making informed investment decisions. Try Stock Unlock free to see if it fits your workflow. No credit card required.