Stock Unlock for Fundamental Investors

Master Fundamental Analysis.
Without the Spreadsheets.

Access 35+ years of financial history, fair-value calculations, and powerful visualizations. Stop manually updating spreadsheets and start analyzing businesses.

35+ Years of History, KPIs & Metrics

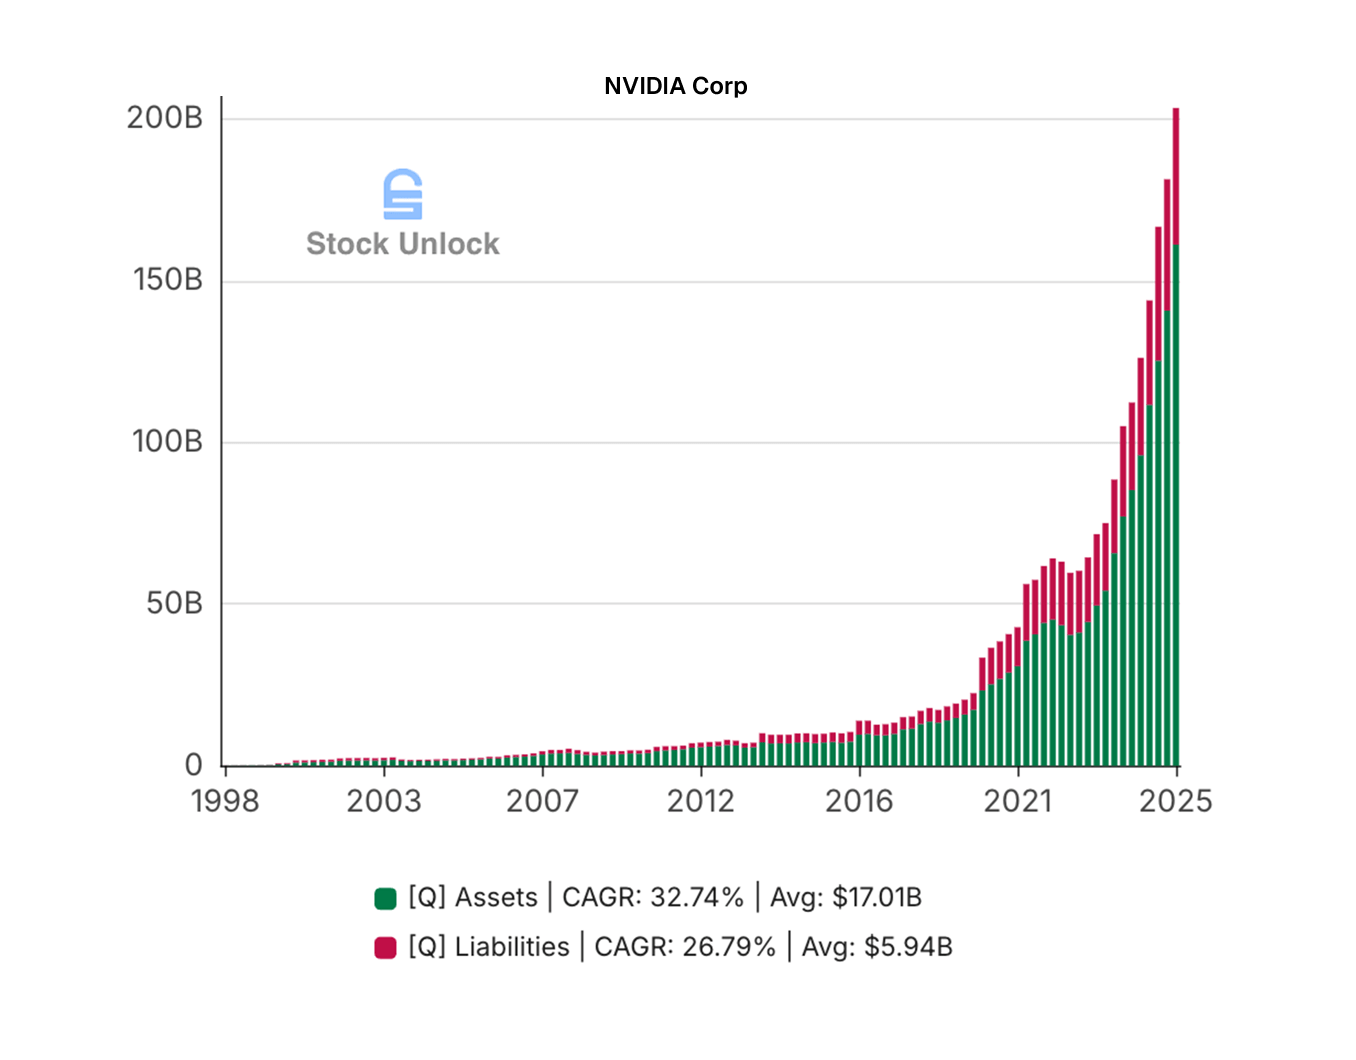
Deep History, KPIs & Visual Metrics

Stop digging through annual reports. Access 35+ years of financials and visualize key metrics like ROIC, Margins, and FCF growth instantly. Plus 10+ years of company-specific KPIs.

Spot trends at a glance. No more manual spreadsheets. Just clear, side-by-side business performance analysis.

Explore JPMorgan's Fundamentals
35 Years of Financial History and Visual Metrics
Discounted Cash Flow Valuation Tool
Powerful Valuation Calculator

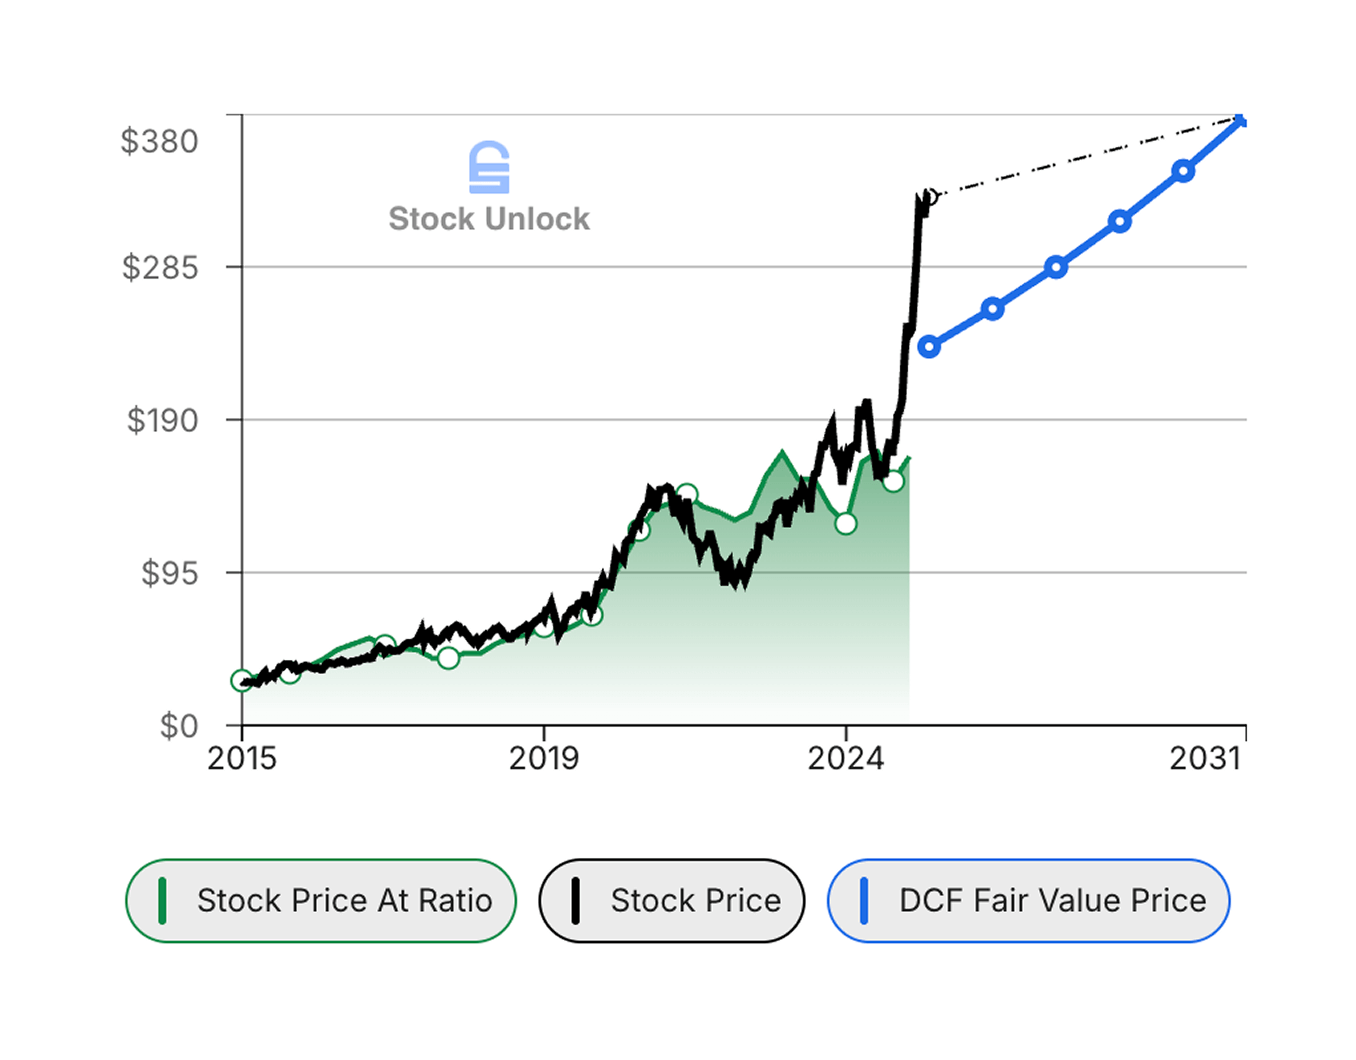
Calculate Fair Value in Seconds

Built-in DCF calculator with 7 valuation methods: Free Cash Flow, Operating Cash Flow, Earnings, EBITDA, EBIT, Operating Income, and Book Value. No more broken spreadsheet links.

Visual fair value charts show intrinsic value and margin of safety at a glance. Know what a stock is worth instantly.

Fundamental Screener

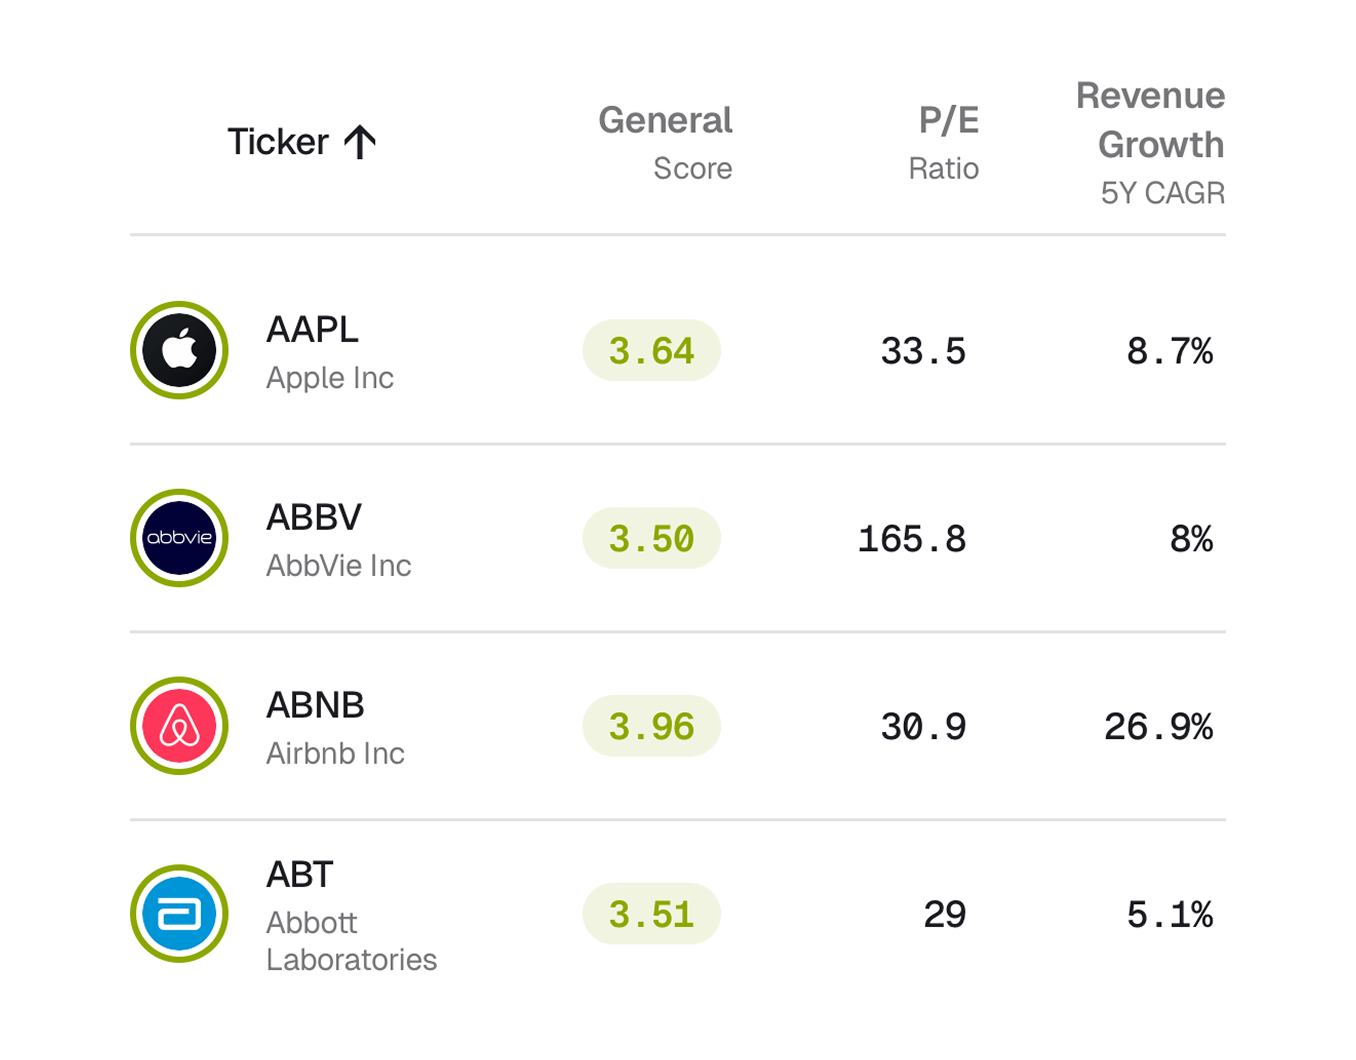
Find Quality Compounders

Screen 100,000+ stocks by fundamental criteria. Find companies with 15%+ ROIC, consistent revenue growth, and low debt.

Build your watchlist of high-quality businesses. Save your screens and revisit anytime as new data comes in.

Fundamental Stock Screener

Why Fundamental Investors Switch
(And Never Look Back)

The Old Way

  • Spreadsheet Hell

    Manually inputting data from annual reports. Breaking formulas every quarter.

  • Fragmented Data

    One site for prices, another for financials, another for news. It's a mess.

  • Static Numbers

    Seeing a P/E ratio is useless without the context of its history.

The Stock Unlock Way

  • Automated Updates

    Financials update the moment earnings are released. Your models update automatically.

  • All-in-One Data

    Every metric, ratio, statement, and transcript in one beautiful interface.

  • Visual Insights

    Charts that provide context. See the story behind the numbers instantly.

Fundamental Analysis FAQ

Common questions from value investors and fundamental analysts

How do I use the DCF calculator to find intrinsic value?

Stock Unlock's DCF calculator pre-fills with the company's actual financials and analyst growth estimates, letting you calculate fair value in seconds. Adjust the growth rate, discount rate (WACC), and terminal multiple to match your thesis. The intrinsic value updates instantly as you change inputs.

Choose between free cash flow to firm (FCFF) or free cash flow to equity (FCFE) models depending on capital structure. Use our 35 years of historical data to validate assumptions, for example, checking if your projected margins are realistic based on past performance. Save models and revisit as earnings update.

What financial statements can I access?

Stock Unlock provides complete income statements, balance sheets, and cash flow statements for 100,000+ stocks globally. View quarterly or annual data going back up to 35 years on premium plans. All financials are standardized to GAAP for easy comparison across companies.

Beyond raw statements, we calculate derivative metrics and valuation ratios automatically: free cash flow, ROIC, debt ratios, working capital, P/E, P/FCF, EV/EBITDA, and more. Premium users also get 10 years of company-specific KPI and segment data powered by Fiscal.ai for deeper analysis of diversified companies.

How do I calculate a stock's intrinsic value?

Intrinsic value is typically calculated using discounted cash flow (DCF) analysis: project future free cash flows, discount them back to present value using an appropriate rate, and add terminal value. Stock Unlock's DCF tool automates the math, while you focus on the assumptions.

Alternative methods include earnings multiples (P/E compared to growth rate), dividend discount models for income stocks, or asset-based valuation for holding companies. Our Valuation Score synthesizes multiple approaches to flag potentially undervalued or overvalued stocks.

What tools does Stock Unlock offer for value investing?

Stock Unlock was built for long-term value investors. DCF Calculator: 7 valuation methods (FCF, OCF, Earnings, EBITDA, EBIT, Operating Income, Book Value) with 35 years of historical data to validate assumptions. Stock Screener: 40+ filters including P/E, P/B, P/FCF, EV/EBITDA, ROIC, debt ratios, and margin filters. Pre-built screens for Buffett-style quality, Graham deep value, and dividend value.

Stock Scores: 7 fundamental categories scored 1-5 including Valuation, Profitability, Financial Health, Growth, Dividends, Management, and Analyst. 35 Years of Financials: Income statements, balance sheets, and cash flow statements for cycle analysis. Portfolio Tracker: Connect 30+ brokerages to see your holdings' fundamental health in one place.

How much historical data is available for analysis?

Premium plans include up to 35 years of historical financial data for US companies. This covers the 2008 financial crisis, dot-com bust, COVID crash, and multiple business cycles. Seeing how companies performed through past downturns is essential for fundamental analysis.

View trends in revenue, margins, ROIC, debt levels, and other metrics over decades. Free accounts access 5 years of history, which works for initial screening. Most serious fundamental analysts find the extended history invaluable for validating a company's competitive moat and management quality.

What do the Stock Scores tell me about fundamentals?

Stock Scores break down into seven categories: Valuation (cheap vs expensive), Profitability (margins and returns), Financial Health (debt and liquidity), Growth (revenue and earnings trends), Dividends (yield and safety), Management (capital allocation), and Analyst (Wall Street sentiment). Each uses industry-specific algorithms.

Scores range from 1-5, with visual color coding. Green indicates strength, red signals concern. Click into any score to see the underlying metrics driving it. Scores are a starting point for analysis, not buy/sell signals. They help you quickly identify where to dig deeper.

How do I analyze P/E, P/B, and other valuation ratios?

Stock Unlock displays all major valuation ratios on every stock page: P/E (trailing and forward), P/B, P/S, P/FCF, EV/EBITDA, and PEG ratio. Compare current ratios to the stock's historical average and to industry peers. See how valuations have expanded or contracted over time.

Use the comparison tool to evaluate ratios across multiple stocks simultaneously. The screener lets you filter by any ratio to find cheap stocks relative to earnings, book value, or cash flow. Our Valuation Score synthesizes these metrics into a single view.

Is Stock Unlock free for fundamental analysis?

Yes, the free tier includes substantial fundamental analysis capabilities. Research any stock's financials, ratios, and Stock Scores. Use the screener to find opportunities. Access 5 years of historical data. Free accounts get a 15-day trial of brokerage connection and premium features.

Premium unlocks 35 years of historical data (essential for cycle analysis), unlimited Stock Scores, and full DCF modeling. Most fundamental analysts find the extended historical data worth the upgrade for serious research. Try free for 15 days with brokerage connection, or upgrade with our 30-day money-back guarantee.

Where does Stock Unlock get its financial data?

Our market data and financial statements are powered by Finnhub Stock API, a trusted institutional-grade data provider used by hedge funds and financial institutions worldwide. We never store or share your personal information with data providers.

Company-specific KPIs and segment data come from Fiscal.ai, providing 10+ years of business-level metrics for deeper analysis. All data is updated as companies file their quarterly and annual reports. For brokerage connections, we use bank-level encryption through our partner Snaptrade, and never store your brokerage credentials.

Still have questions?