Stock Unlock for Dividend Investors

Track Income. Forecast Growth.
In One Place.

Replace your manual dividend spreadsheets with automated tracking. See your future income, analyze yield safety, and manage your cash flow in one place.

Income Forecasting

Know Exactly How Much You'll Get Paid

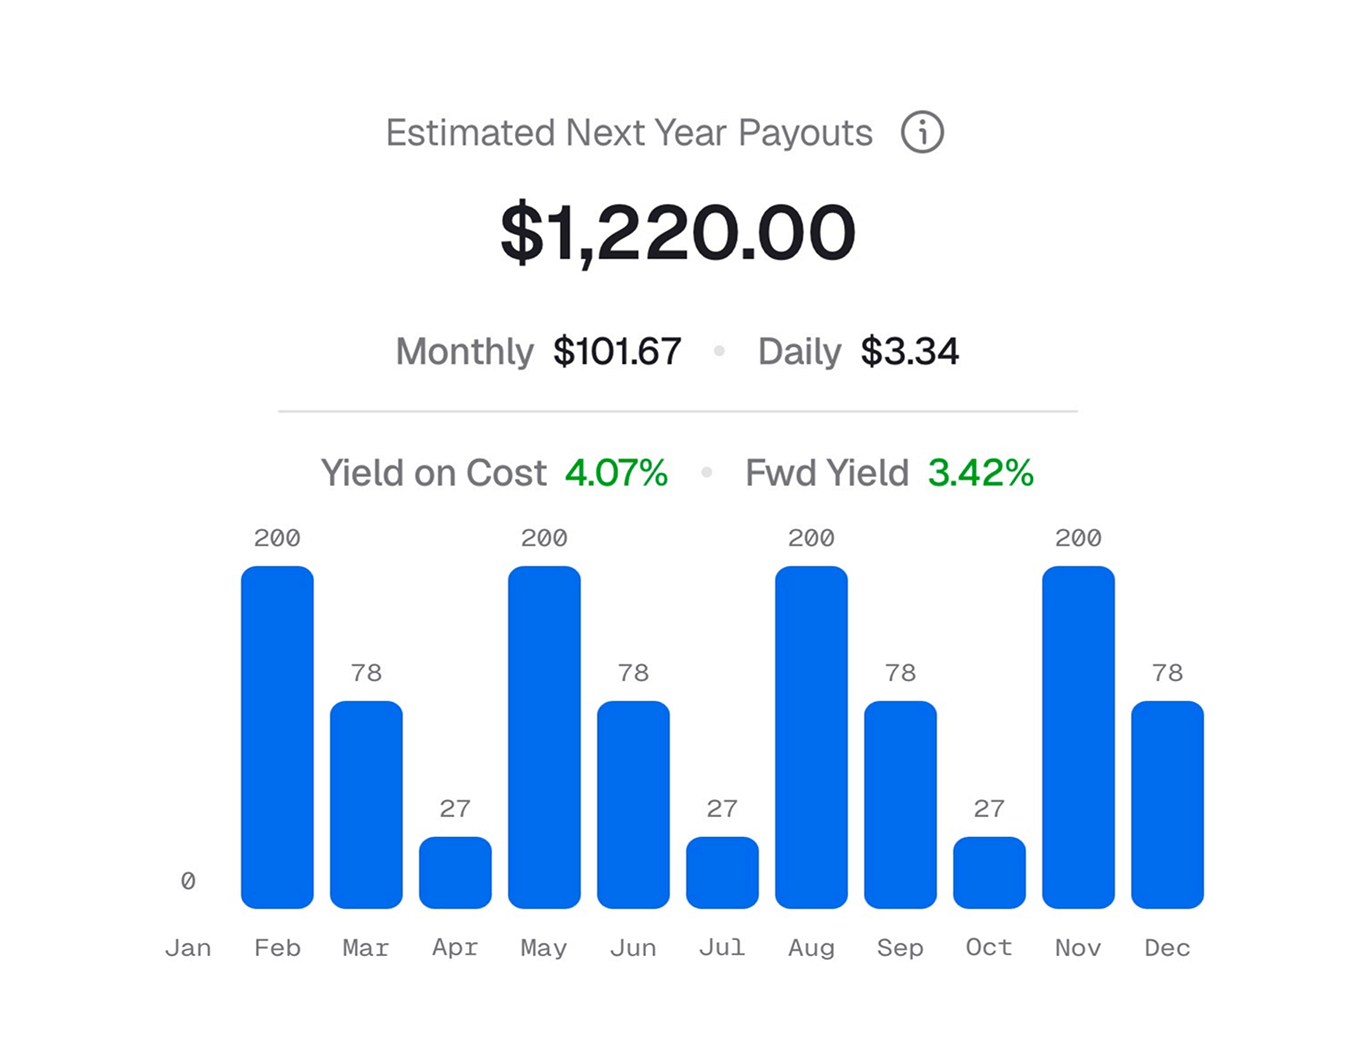
See your upcoming dividend payments in a clear calendar view. We project your future income based on current holdings and historical growth rates.

Track Yield on Cost, monthly payouts, and plan your cash flow with confidence.

Dividend Income Forecasting
Dividend Safety Metrics
Dividend Safety

Avoid Yield Traps Before You Buy

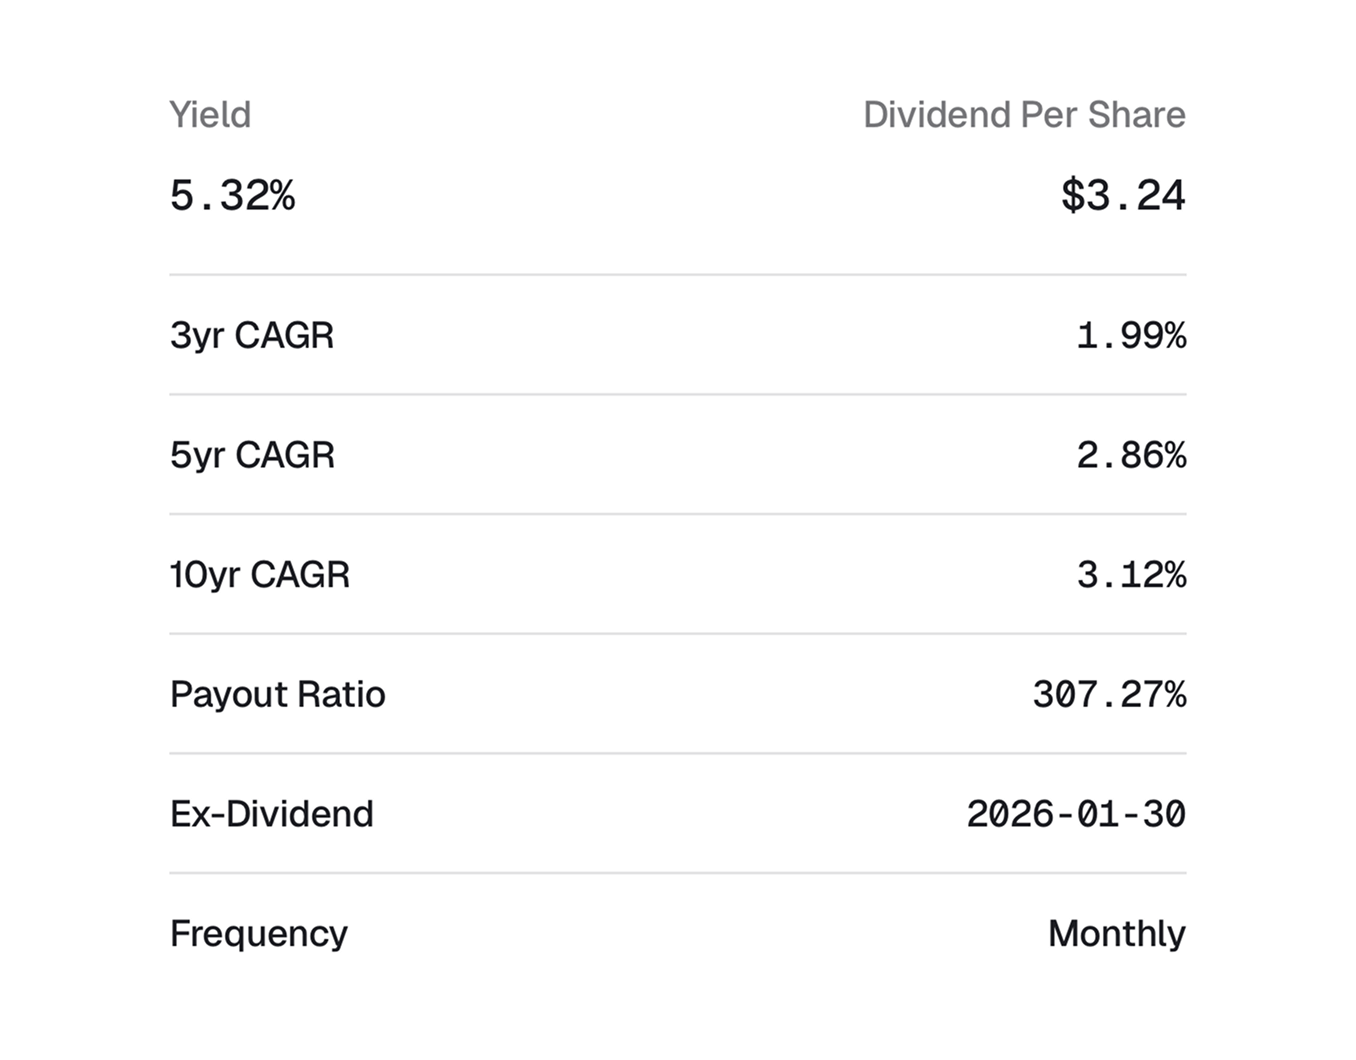
Don't just chase high yields. Our Dividend Stock Score analyzes payout ratios, dividend growth history (up to 35 years), and free cash flow coverage. Get a quick 1-5 rating so you can spot at-risk dividends before they get cut.

Ensure the company can afford to keep paying you before you commit your capital.

Find Gems

Find the Aristocrats of Tomorrow

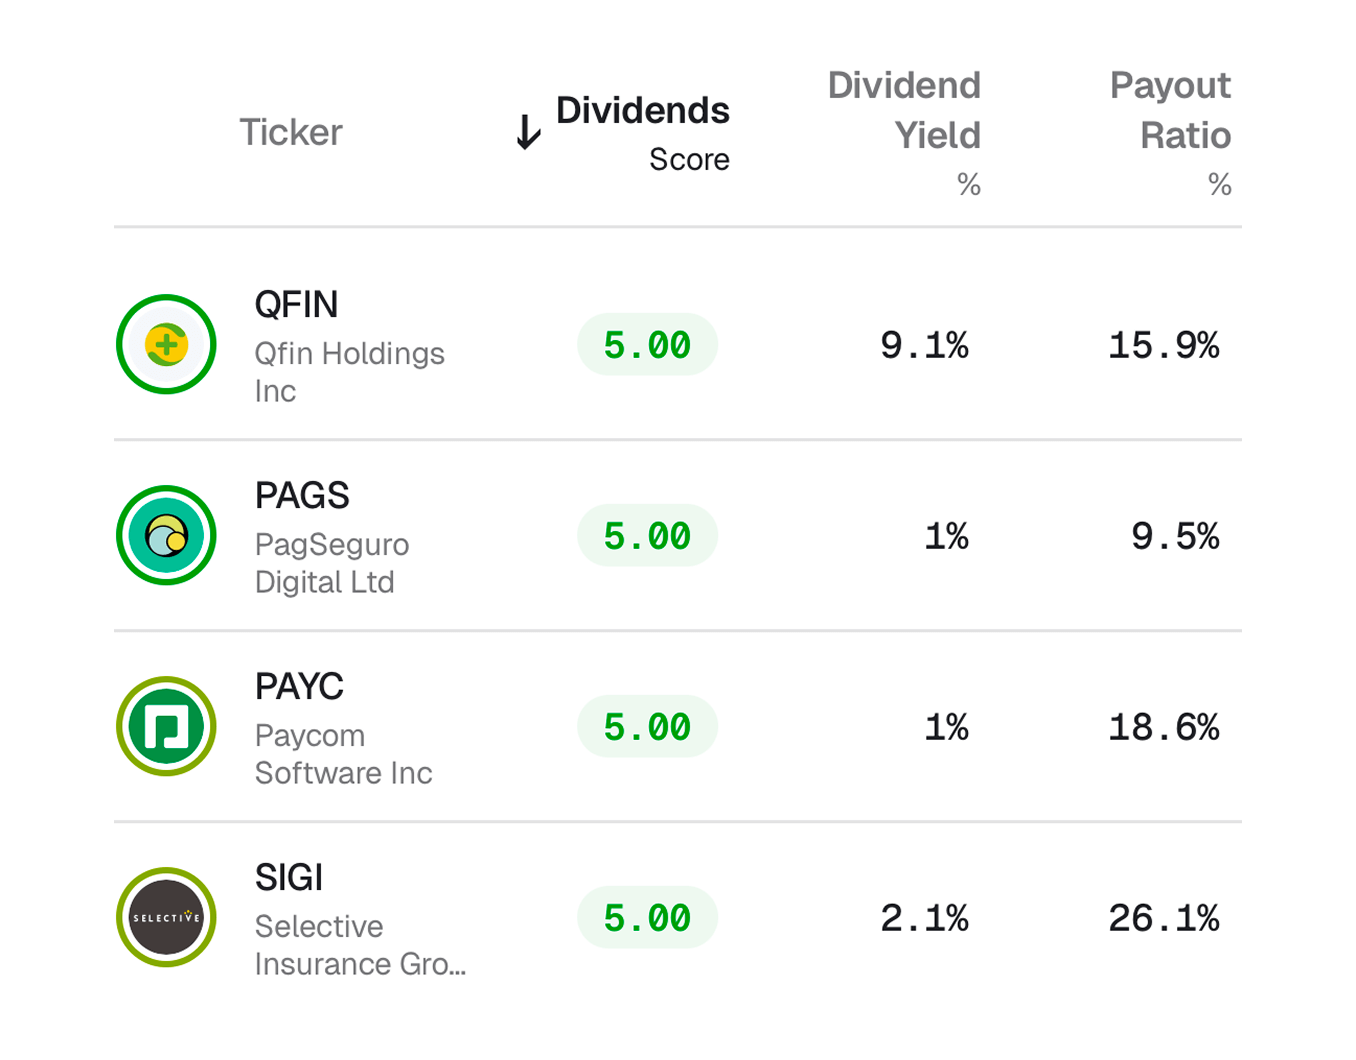
Filter by Dividend Yield, 5-Year Dividend Growth (CAGR), Payout Ratio, and Dividend Stock Score.

Find companies that pay you to hold them. Over 40+ filters to pinpoint your perfect income stock or ETF across 100,000+ securities. Learn more about our screener.

Launch Dividend Screener
Dividend Stock Screener Interface
Dividend History Charts
35 Years of History

Visualize the Cut History

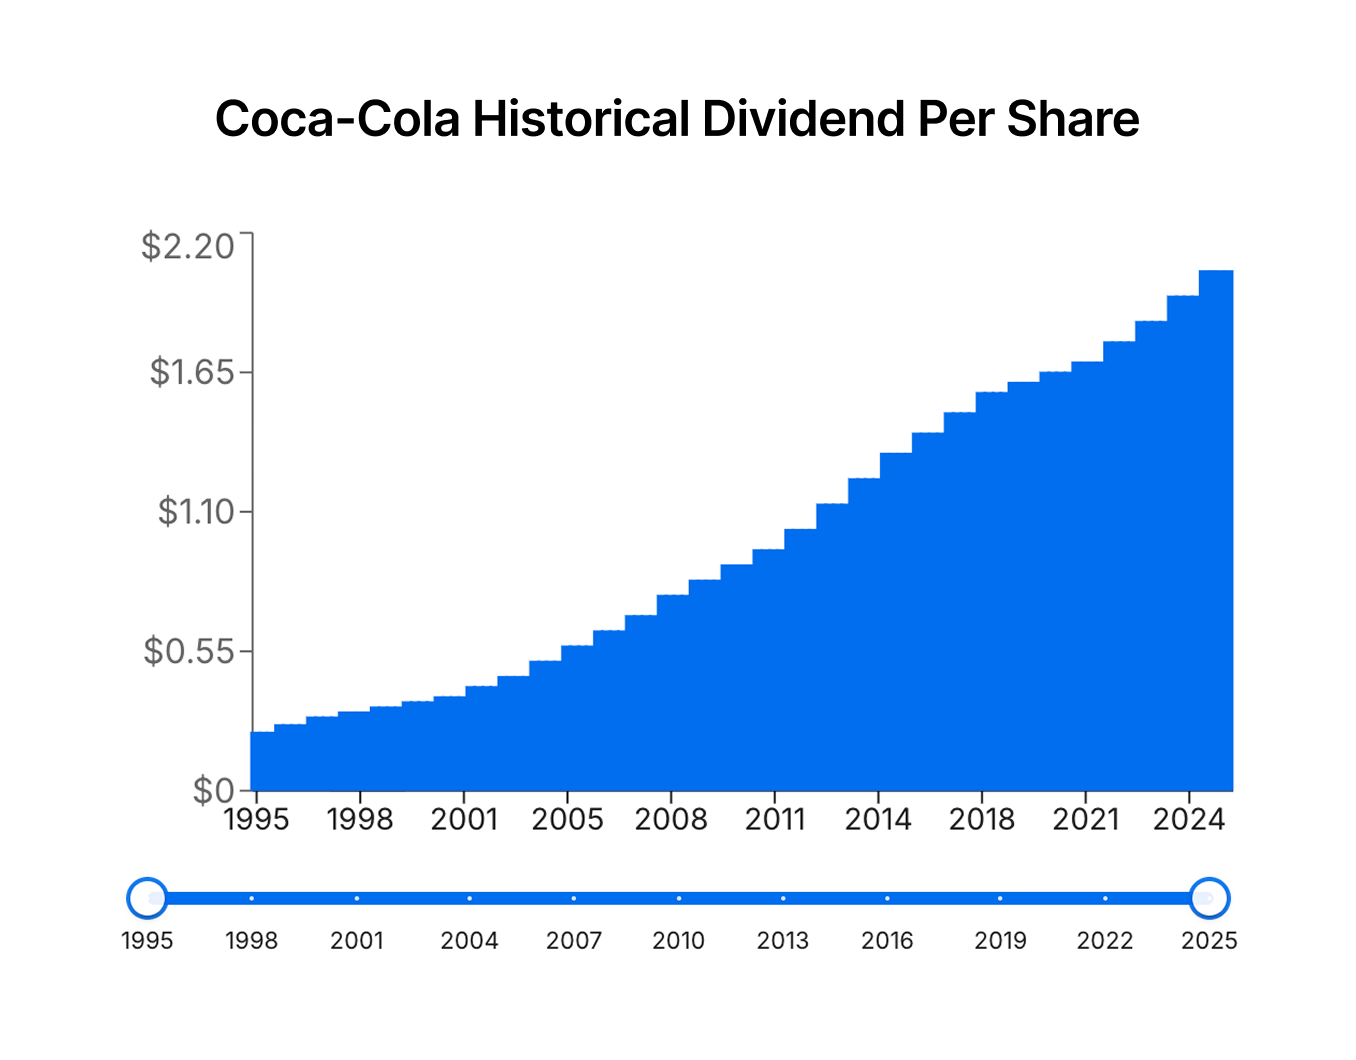
See at a glance if a stock or ETF has ever cut its dividend. Plot 'Dividends Per Share' over the last 35+ years to see the trend instantly.

Identify consistent growers vs. unreliable payers before you invest.

Why Dividend Investors Switch
(And Never Look Back)

The Old Way

  • Manual Spreadsheet Updates

    Entering every dividend payment by hand. Hoping you didn't miss one.

  • Chasing Yield Traps

    Buying a 10% yield only to watch it get cut 50% next quarter.

  • Surprise Income Gaps

    Not knowing which month is light on cash until it's too late.

The Stock Unlock Way

  • Automated Sync

    Connect your brokerage and we handle the math. Every dividend, every payment, tracked automatically.

  • Safety First

    Data-driven payout analysis and 35 years of dividend history so you invest in reliable payers.

  • Predictable Cash Flow

    Accurate forward-looking income estimates. Know exactly what's coming each month.

Dividend Investing FAQ

Common questions from dividend and income investors

How does Stock Unlock track my dividend income?

Stock Unlock automatically tracks dividend income for all stocks and ETFs in your portfolios. Connect your brokerage for automatic syncing, or add holdings manually. For each holding, we show dividend history (up to 35 years on Unlimited), ex-dividend dates, current yield, payout ratios, and growth rates.

Our portfolio dashboard displays your total projected annual income, upcoming payments, and a calendar view of when dividends will hit your account. You can also see which holdings contribute most to your income and identify concentration risks.

Is Stock Unlock free for dividend investors?

Yes, Stock Unlock offers substantial free features for dividend investors. You can research any stock's dividend data, use our screener to find dividend stocks and ETFs, and track a portfolio without paying. Free accounts also get a 15-day trial of brokerage connection for automatic portfolio syncing.

Premium plans unlock extended dividend history (up to 35 years on Unlimited vs limited data on free), full access to Stock Scores including our Dividend Stock Score, and permanent brokerage connections. Most dividend investors find the extended history invaluable for evaluating how companies performed through past recessions. All plans include a 30-day money-back guarantee.

How do I find the best dividend stocks to buy?

Use Stock Unlock's screener to filter stocks and ETFs by dividend yield, 5-year dividend growth (CAGR), payout ratio, and Dividend Stock Score. Our screener covers 100,000+ securities across 70+ global exchanges, so you can find income opportunities beyond just US markets.

Start with our pre-built "Top Dividend Stocks" screener filter, which surfaces high-quality dividend payers with strong safety scores. From there, customize filters based on your income goals: high yield, dividend growth, or maximum safety. Each result links directly to detailed dividend analysis.

How do I know if a dividend is safe?

A dividend is considered safe when the company's payout ratio is sustainable, earnings are stable or growing, and debt levels are manageable. However, "sustainable" varies by company type. REITs legally must pay 90%+ of income, so a 95% payout ratio might be fine for a REIT but dangerous for a tech company. Stock Unlock's Dividend Stock Score analyzes these factors automatically, giving each stock a 1-5 rating so you can quickly identify at-risk dividends.

Beyond earnings payout ratio, examine the free cash flow payout ratio (what the company can actually afford from cash generated), debt-to-equity ratios, and the company's dividend history through past recessions. Stock Unlock shows you up to 35 years of dividend history so you can see how companies performed during downturns like 2008 and 2020.

Does Stock Unlock support ETF dividends?

Yes, Stock Unlock provides first-class dividend support for ETFs alongside individual stocks. Track dividend history, current yield, distribution frequency, and ex-dividend dates for thousands of ETFs including popular funds like SPY, VYM, SCHD, and international ETFs.

ETF dividends are fully integrated into your portfolio tracking, so you can see projected income from both stocks and ETFs in one view. Our screener also lets you filter ETFs by dividend yield and other criteria, making it easy to find income-focused funds that match your strategy.

How do I calculate my expected dividend income?

To calculate expected dividend income, multiply your shares by the annual dividend per share. For example, if you own 100 shares of a stock paying $4 annually, you'd receive $400 per year. Stock Unlock automates this calculation across your entire portfolio, showing projected income by month, quarter, and year.

Important timing note: you must own shares before the ex-dividend date to receive the next payment. Our portfolio tracker shows upcoming ex-dividend dates so you know when to buy (or hold). Remember that dividend income is typically taxable. Qualified dividends are taxed at capital gains rates, while non-qualified dividends are taxed as ordinary income. Consult a tax professional for your specific situation.

What is dividend payout ratio and why does it matter?

The dividend payout ratio measures what percentage of a company's earnings are paid out as dividends. A payout ratio of 50% means the company pays half its earnings to shareholders and retains half for growth. However, "safe" ratios vary significantly by sector. REITs are legally required to pay out 90%+ of income, and utilities often run higher ratios by design.

For many companies, the free cash flow payout ratio is more meaningful than the earnings-based ratio, since it shows what the company can actually afford to pay from cash generated. Stock Unlock calculates and displays both payout ratios automatically, and our Dividend Stock Score factors these into its analysis so you can quickly spot warning signs.

How do dividend yield, yield on cost, and growth relate?

Dividend yield is the annual dividend divided by the current stock price. Yield on cost is the annual dividend divided by what you originally paid. This grows as companies raise dividends, making your original investment increasingly valuable. Dividend growth measures how fast a company increases its dividend over time.

A 3% yield with 10% annual growth often outperforms a 6% yield with 0% growth over the long term due to compounding. Stock Unlock shows all three metrics: current yield, dividend growth rate (5-year CAGR), and yield on cost for your portfolio holdings.

See Johnson & Johnson's Dividend History

Still have questions?