Choosing between Seeking Alpha and Simply Wall St for your investment research often comes down to these fundamental questions:
- Do you want crowdsourced opinions from thousands of analysts, or do you prefer automated, visual analysis of company fundamentals?
- Are you willing to pay premium prices for professional-grade research, or do you need powerful tools at an accessible price point?
- Is reading through lengthy investment articles your preferred research style, or would you rather see data visualized in easy-to-understand graphics?
- Do you need help understanding what financial metrics actually mean, or are you already fluent in investment terminology?
- Are you looking for a platform that tells you what to think, or one that teaches you how to think about investments?
In short, here's what we recommend:
👉 Seeking Alpha is the crowdsourced investment community for serious, self-directed investors who want access to thousands of analyst opinions and in-depth stock analysis. With over 7,000 independent contributors who collectively publish around 400 articles daily, and proprietary Quant Ratings that the company claims have historically outperformed the S&P 500, it offers a wealth of perspectives on virtually any stock.
However, the quality of analysis varies significantly between contributors, the Premium subscription starts at $299 per year (with promotional pricing that can lock users into higher rates), and the sheer volume of content can be overwhelming for investors who just want clear, actionable insights.
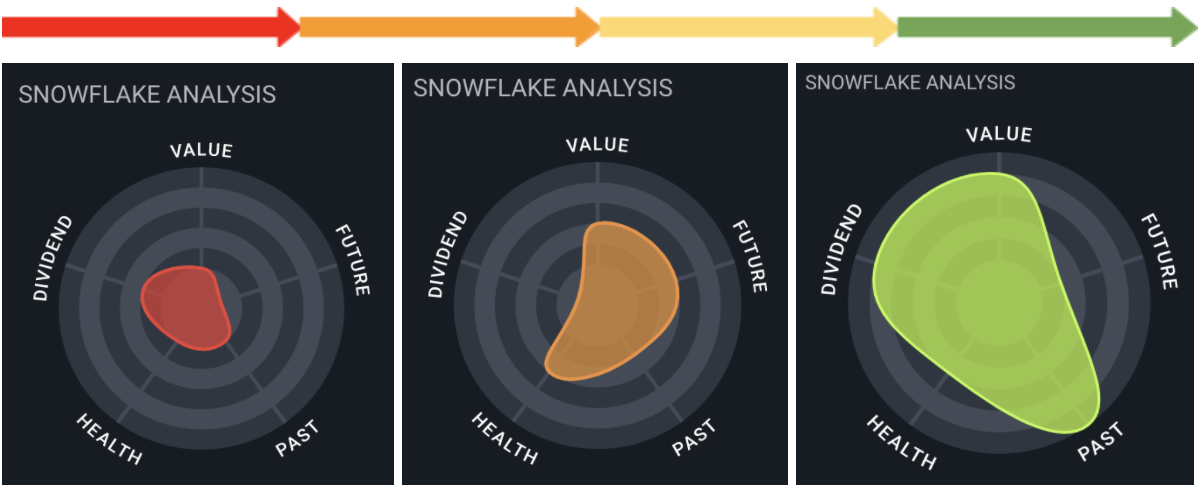
👉 Simply Wall St transforms complex financial data into visual infographics, making fundamental analysis more accessible for beginners and visual learners. Its signature "Snowflake" graphic provides an instant overview of a company's profile across value, growth, health, dividends, and past performance.
While the visual interface and affordable pricing (starting around $10 per month when billed annually) can serve as a starting point, investors often find the analysis oversimplified for serious due diligence. The automated fair value calculations rely on standardized assumptions, and the platform has developed a reputation for frequent upsell prompts that can frustrate users expecting a more straightforward experience.
Both platforms serve important roles in the investment research ecosystem. However, neither fully bridges the gap between powerful analysis tools and genuine investor education. That's why we included Stock Unlock in the comparison.
👉 Stock Unlock was built from the frustration that many investors share: paying for multiple expensive tools that still leave gaps in your research process. Founded by Daniel Pronk, a long-time investor and financial educator, and Jake Ruth, an engineer and investor, both went through the journey of learning fundamental analysis themselves, overpaying for tools that led to costly mistakes along the way. They stuck with it, spent years mastering the craft, and consolidated everything they learned into one platform.
Stock Unlock combines comprehensive fundamental analysis with integrated education through its optional "Learn Mode," proprietary Stock Scores calibrated for different industries, and a generous free tier that lets you explore the platform without a credit card. Free accounts include limited searches on the DCF calculator and screener each week, plus a 15-day free brokerage connection to test portfolio tracking. If you upgrade, there's also a 30-day money-back guarantee. The platform covers over 170,000 stocks and ETFs across 70+ global exchanges with up to 35 years of historical data, all at a fraction of competitors' prices.
If you want a platform that makes you a better investor while you research, try Stock Unlock's tools free and see the difference for yourself.
Table of contents:
- Seeking Alpha vs Simply Wall St vs Stock Unlock at a glance
- The fundamental divide: Opinions vs visuals vs education
- Seeking Alpha excels at crowdsourced analysis and community insights
- Simply Wall St focuses on visual data presentation
- Stock Unlock bridges analysis and education
- Pricing reveals each platform's target audience
- Portfolio tracking capabilities vary significantly
- Stock screening approaches reflect different philosophies
- Data depth and accuracy matter for long-term decisions
- Seeking Alpha vs Simply Wall St vs Stock Unlock: Which should you choose?
Seeking Alpha vs Simply Wall St vs Stock Unlock at a glance
| Seeking Alpha | Simply Wall St | Stock Unlock | |
|---|---|---|---|
| Primary approach | Crowdsourced analyst opinions | Visual automated analysis | Complete fundamental analysis toolkit |
| Content source | 7,000+ active contributors | Automated algorithms | Proprietary scoring algorithms |
| Learning curve | ⭐⭐⭐ Steep (content volume) |
⭐⭐⭐⭐ Moderate |
⭐⭐⭐⭐⭐ Gentle (Learn Mode) |
| Data visualization | ⭐⭐ Text-heavy |
⭐⭐⭐⭐⭐ Excellent infographics |
⭐⭐⭐⭐⭐ Clean and intuitive |
| Educational features | ⭐⭐⭐ External resources |
⭐⭐⭐ Basic explanations |
⭐⭐⭐⭐⭐ Integrated Learn Mode |
| Historical data depth | ⭐⭐⭐⭐ 10 years (Premium) |
⭐⭐⭐⭐ 10 years (Premium) |
⭐⭐⭐⭐⭐ Up to 35 years |
| Global coverage | ⭐⭐ Primarily US focused |
⭐⭐⭐⭐ 100,000+ stocks and ETFs globally |
⭐⭐⭐⭐⭐ 170,000+ stocks and ETFs globally |
| Free brokerage trial | ❌ Not available | ❌ Limited to paid tiers | ✅ 15 days free, no credit card |
| Mobile apps | ✅ iOS and Android | ✅ iOS and Android | ✅ iOS and Android |
| Starting price | $299/year (Premium) | $120/year (Premium) | Starting at $9/month |
| Stock Unlock | Seeking Alpha | |
|---|---|---|
| Primary approach | Complete fundamental toolkit | Crowdsourced opinions |
| Content source | Proprietary algorithms | 7,000+ contributors |
| Learning curve | ⭐⭐⭐⭐⭐ Gentle | ⭐⭐⭐ Steep |
| Data visualization | ⭐⭐⭐⭐⭐ Clean | ⭐⭐ Text-heavy |
| Educational features | ⭐⭐⭐⭐⭐ Learn Mode | ⭐⭐⭐ External |
| Historical data | ⭐⭐⭐⭐⭐ 35 years | ⭐⭐⭐⭐ 10 years |
| Global coverage | ⭐⭐⭐⭐⭐ 170K+ stocks | ⭐⭐ US focused |
| Free brokerage trial | ✅ 15 days free | ❌ No |
| Mobile apps | ✅ iOS & Android | ✅ iOS & Android |
| Starting price | $9/month | $299/year |
The fundamental divide: Opinions vs visuals vs education
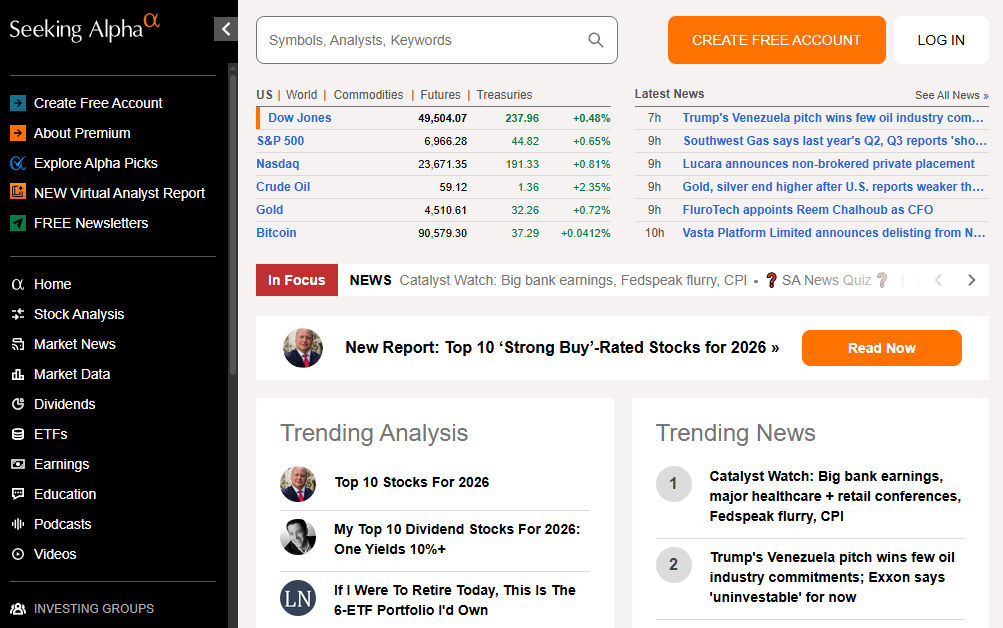
Seeking Alpha built its reputation on democratizing investment research through crowdsourcing.
The platform publishes approximately 400 articles and news updates daily from over 7,000 independent analysts. This model provides remarkable breadth of coverage, including stocks that Wall Street analysts often overlook. The diversity of viewpoints, bullish, bearish, and neutral, on any given stock can be invaluable for developing a well-rounded investment thesis.
Simply Wall St took a fundamentally different approach.
Rather than aggregating human opinions, the founders recognized that many retail investors struggle to interpret traditional financial statements. Their solution was to transform complex data into visual infographics, most notably the "Snowflake" diagram that scores companies across five key dimensions.
This visual approach makes fundamental analysis feel less intimidating for investors who would otherwise be overwhelmed by spreadsheets and financial jargon. However, the platform's development has largely plateaued in recent years, and many users report that the visual simplicity comes at the cost of analytical depth.
Stock Unlock represents a third philosophy entirely, one born from genuine frustration with the industry.
Co-founder Daniel Pronk spent years juggling multiple expensive investing tools while maintaining time-consuming spreadsheets. Back in 2020, Jake Ruth, an engineer and investor, grew frustrated watching smart investors like Daniel struggle with tools that charged premium prices for inadequate features and scores that didn't actually work.
What started as a personal project to automate Daniel's spreadsheet work evolved into a platform built on a core belief: retail investors deserve professional-grade tools without the professional-grade price tag.
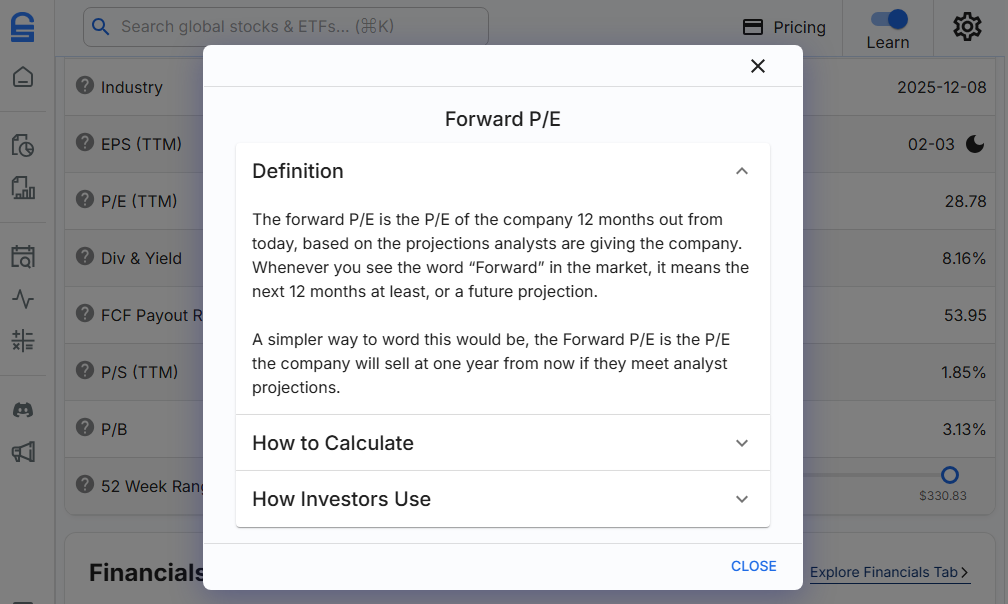
The platform's "Learn Mode" provides contextual explanations throughout the interface, acting like training wheels for new investors while remaining easy to toggle off for experienced users who want to move quickly. This approach recognizes that the best investment tool is one that makes you a better investor over time, not just one that tells you what to buy.
Seeking Alpha excels at crowdsourced analysis and community insights
Seeking Alpha's greatest strength lies in the diversity and depth of its contributor base.
Over the years, more than 18,000 people have contributed articles to the platform, with approximately 7,000 currently active contributors publishing around 400 articles daily. This coverage includes stocks that receive little to no attention from traditional Wall Street research, which is particularly valuable for investors interested in smaller opportunities or niche sectors.
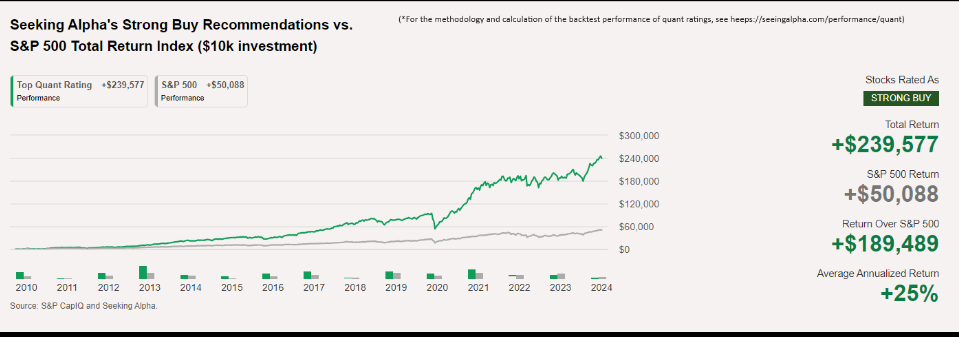
The platform's proprietary Quant Ratings have established a notable track record.
According to Seeking Alpha's back-tested marketing data, "Strong Buy" rated stocks have significantly outperformed the S&P 500 over the past decade, though it's worth noting these claims rely on top-performing selections and time periods. Research from the University of Kentucky found statistically significant excess returns for top-rated stocks, though it's worth approaching such back-tested results with some healthy skepticism.
These ratings analyze over 100 metrics for each stock across five key factors: Value, Growth, Profitability, Momentum, and EPS Revisions.
The community aspect is also a significant differentiator. Article comment sections often feature debates where readers challenge authors' assumptions, point out errors, and offer alternative perspectives. For investors who enjoy engaging with diverse viewpoints and don't mind filtering through varying quality levels, this collaborative environment can be valuable.
However, the crowdsourced model has inherent limitations.
Content quality varies significantly from one contributor to another. While Seeking Alpha's editorial team reviews articles, the subjective nature of investment analysis means users must develop their own ability to evaluate which contributors provide genuine insight versus those who may have biased perspectives. The sheer volume of content can also be overwhelming, particularly for newer investors who may struggle to identify which analyses deserve attention.
Simply Wall St focuses on visual data presentation
Simply Wall St has carved out a niche by making financial data visually intuitive.
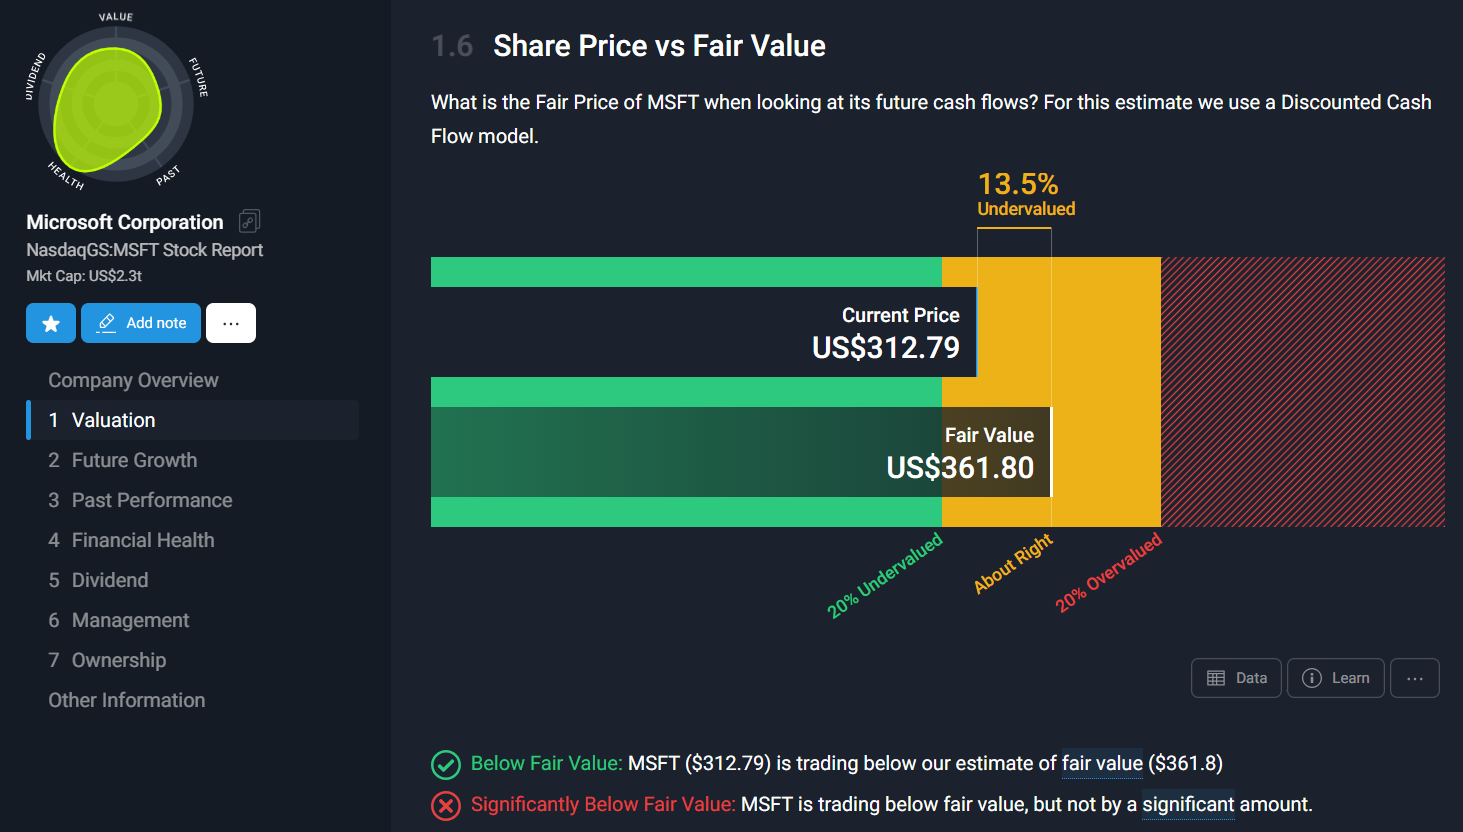
The platform's signature "Snowflake" graphic provides an instant visual summary of a company's investment profile, with each axis representing a key dimension: Value, Future Growth, Past Performance, Financial Health, and Dividends.
This visual approach appeals particularly to investors who learn better through graphics than text or numbers. Instead of reading through financial statements, users can see at a glance whether a company appears undervalued, has strong growth prospects, or carries concerning debt levels. The consistent format across all company reports enables easy comparison between different investment opportunities.
The platform's global coverage is notable, with detailed reports on 120,000 stocks across 90 global markets. For investors seeking international diversification, Simply Wall St provides analysis on markets that many US-focused platforms cover less comprehensively.
However, Simply Wall St has notable drawbacks that prospective users should consider.
The visual simplicity that makes the platform accessible also represents its primary limitation: experienced investors often find the analysis lacks the depth needed for serious due diligence. The automated fair value calculations, based on discounted cash flow models with standardized assumptions, may not account for company-specific nuances that materially affect valuation.
Additionally, user reviews on TrustPilot reveal a pattern of frustration with the platform's tiered subscription model. The Free plan is extremely limited (5 reports per month), the Premium plan ($10/month) still imposes significant restrictions (30 reports per month), and users frequently encounter prompts to upgrade.
This upsell-heavy approach can feel at odds with the clean, user-friendly interface the platform promotes. The scoring methodology, while visually appealing, lacks the transparency and proven track record that more experienced investors expect, and tools like the DCF calculator and screener have drawn criticism for being less intuitive than they appear.
Stock Unlock bridges analysis and education
Stock Unlock takes a fundamentally different approach by recognizing that most investors don't just need data, they need to understand what the data means and how to use it. The platform was built by investors, for investors, from genuine frustration with an industry that charges too much for tools that don't deliver.
The founding story matters here. Daniel Pronk, a long-time investor and financial educator with a following on YouTube, spent years paying for multiple expensive investing platforms while still maintaining complex spreadsheets to fill in the gaps. Jake Ruth, an engineer who followed Daniel's investment content, saw an industry problem: smart retail investors were wasting money on inadequate tools with scores that didn't actually work, some even dangerously misleading.
What started as a personal project to automate spreadsheet work became Stock Unlock, backed by Y Combinator and Goodwater Capital.
This origin story shapes everything about the platform. When Learn Mode is activated, contextual explanations appear throughout. Click on any metric, whether it's the P/E ratio, free cash flow, or debt-to-equity ratio, and you'll see a clear explanation of what it measures, how it's calculated, and how investors typically interpret it.
This approach helps users build genuine financial literacy rather than just consuming pre-packaged conclusions.
The platform's proprietary Stock Scores evaluate companies across seven key dimensions:
- Growth
- Analyst
- Valuation
- Dividends
- Profitability
- Financial Health
- Management
Crucially, these scores are calibrated specifically for different industries and even individual stocks, recognizing that the metrics that matter for evaluating a technology company differ significantly from those relevant for a bank or utility.
The Stock Unlock team has invested years of engineering work into creating systems where algorithms are tailored by industry and, in many cases, per stock, incorporating unique KPIs and company data. On top of that, the algorithms are constantly tested and iterated on.
Unlike generic algorithmic scores found on other platforms, Stock Unlock's scoring system was built and battle-tested over years with industry-specific and stock-specific calibration.
Stock Unlock also offers exceptional data depth. Premium plans provide access to up to 35 years of historical financial data, allowing investors to analyze how companies have performed across multiple economic cycles. This long-term perspective is particularly valuable for identifying truly durable business models versus companies that have simply benefited from favorable short-term conditions.
The platform serves two core audiences particularly well.
First, experienced investors (often in their 30s to 60s and beyond) who have been juggling multiple analysis tools and maintaining messy spreadsheets for years find relief in consolidating everything into one cohesive platform. Second, committed new investors who have mentally decided that building a portfolio is important for their long-term wealth but don't know how to start.
These aren't casual "I heard about Nvidia" investors. They're people convinced that proper fundamental analysis matters, and Stock Unlock provides the training wheels to help them learn the right way from day one.
Pricing reveals each platform's target audience
Seeking Alpha commands premium pricing that reflects its positioning for serious, active investors.
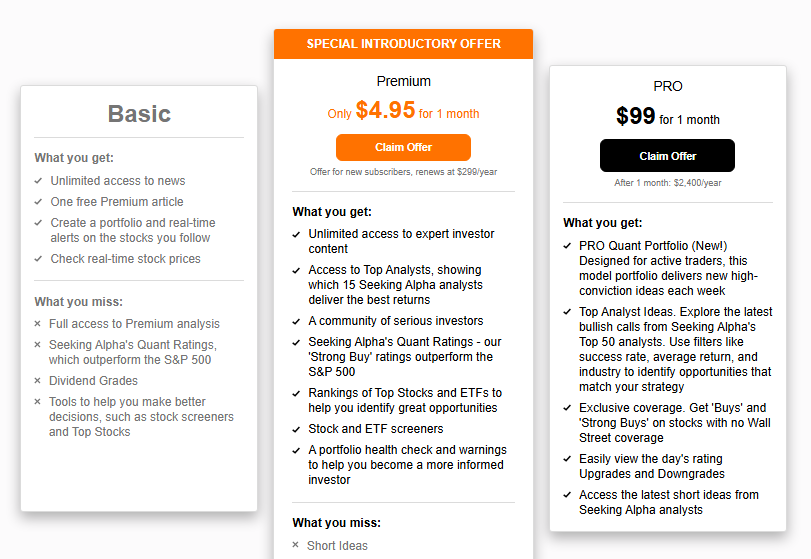
The Premium plan costs $299 annually, while the Pro tier (which includes exclusive high-conviction ideas and VIP support) runs $2,400 per year. The Alpha Picks service, providing two monthly stock recommendations, costs $499 annually (with promotional pricing sometimes available around $449).
It's worth noting that Seeking Alpha's pricing can be confusing: promotional rates often advertise low introductory prices that lock users into higher annual charges, a tactic that has frustrated some subscribers.
These prices assume users will generate returns that justify the expense, and for investors managing substantial portfolios, the cost may be negligible relative to potential gains.
Simply Wall St takes a more accessible approach on the surface.
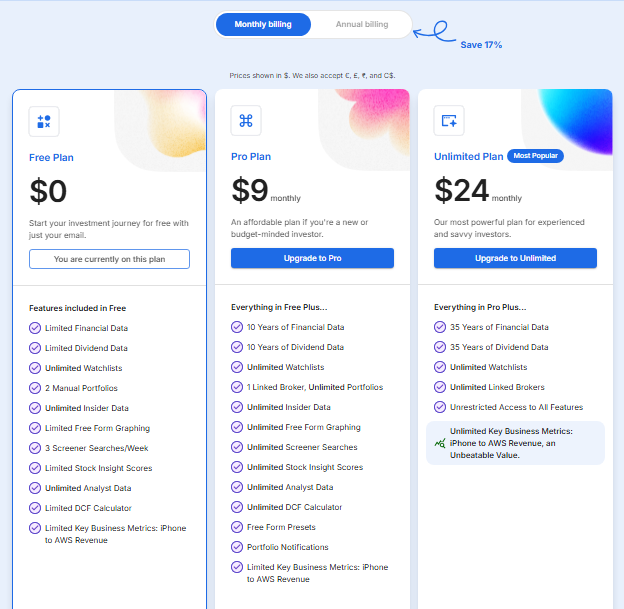
The Premium plan costs around $10 per month when billed annually ($120 per year), while the Unlimited plan runs $21.50 per month ($258 annually). A free tier provides limited access to 5 company reports per month. However, the aggressive tier restrictions mean most active users quickly hit walls that push them toward paid plans, and even the Premium tier imposes meaningful limits (30 reports per month, 3 portfolios).
Stock Unlock was built on a different pricing philosophy: most of your money when investing should go into investing, not $50/month software subscriptions.
The platform offers a generous free tier with substantial functionality: you can explore the entire site, view any stock, and use core features without creating an account. All features have free usage limits, with some users finding the free plan sufficient for their needs.
Free accounts get a limited number of DCF calculator and screener searches each week, and can connect one brokerage account free for 15 days, no credit card required, something most competitors don't offer.
Paid plans start at $9/month for the Pro tier (or less when billed annually), with an Unlimited plan at $24/month that includes 35 years of historical data and unlimited brokerage connections. All paid plans include a 30-day money-back guarantee, reflecting the company's confidence that once you try the platform, you'll find value.
For context, that's roughly one-third the cost of Seeking Alpha Premium and significantly more feature-complete than similarly-priced competitors.
For investors just starting their journey, Stock Unlock's pricing removes a significant barrier to accessing quality research tools, while still providing features that scale as investors' sophistication grows.
Portfolio tracking capabilities vary significantly
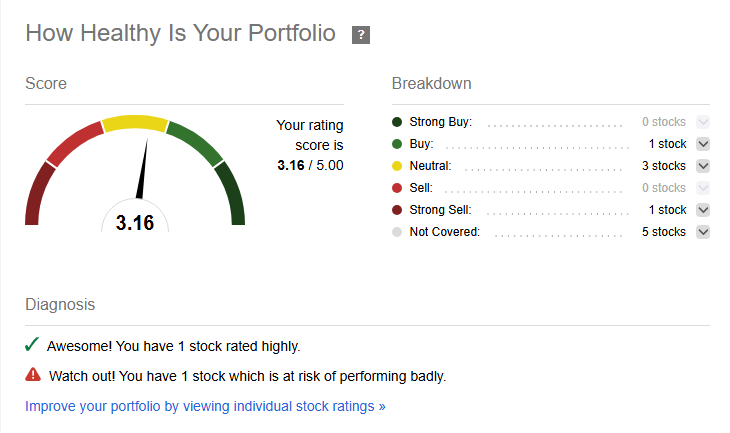
Seeking Alpha's portfolio tool integrates with its content ecosystem, delivering personalized news and analysis about holdings.
Premium subscribers can link brokerage accounts through services like Plaid and SnapTrade for automatic syncing. The platform provides a "Portfolio Health Score" that aggregates Quant Ratings across holdings. However, the primary value proposition is receiving relevant content about portfolio positions rather than advanced portfolio analytics.
Simply Wall St's portfolio tracker emphasizes visual presentation of holdings.
Users can see their portfolio's overall "Snowflake," representing the weighted characteristics of all positions. The platform calculates returns including dividends and currency fluctuations, and provides diversification breakdowns by sector and geography. Brokerage linking is available on premium plans, with daily automatic syncing.
However, the free tier is limited to a single 10-stock portfolio with manual entry only, and even Premium users are capped at 3 portfolios with 30 holdings each.
Stock Unlock's portfolio tracker was built to address the gaps that frustrated the founders in other tools.
Users can connect brokerage accounts through SnapTrade (with a 15-day free trial for all users), add holdings manually, or import via CSV. The platform provides more ways to analyze performance than most brokerages offer, including time-weighted returns, returns with and without dividend income, position back-testing, and multiple configurable data displays.
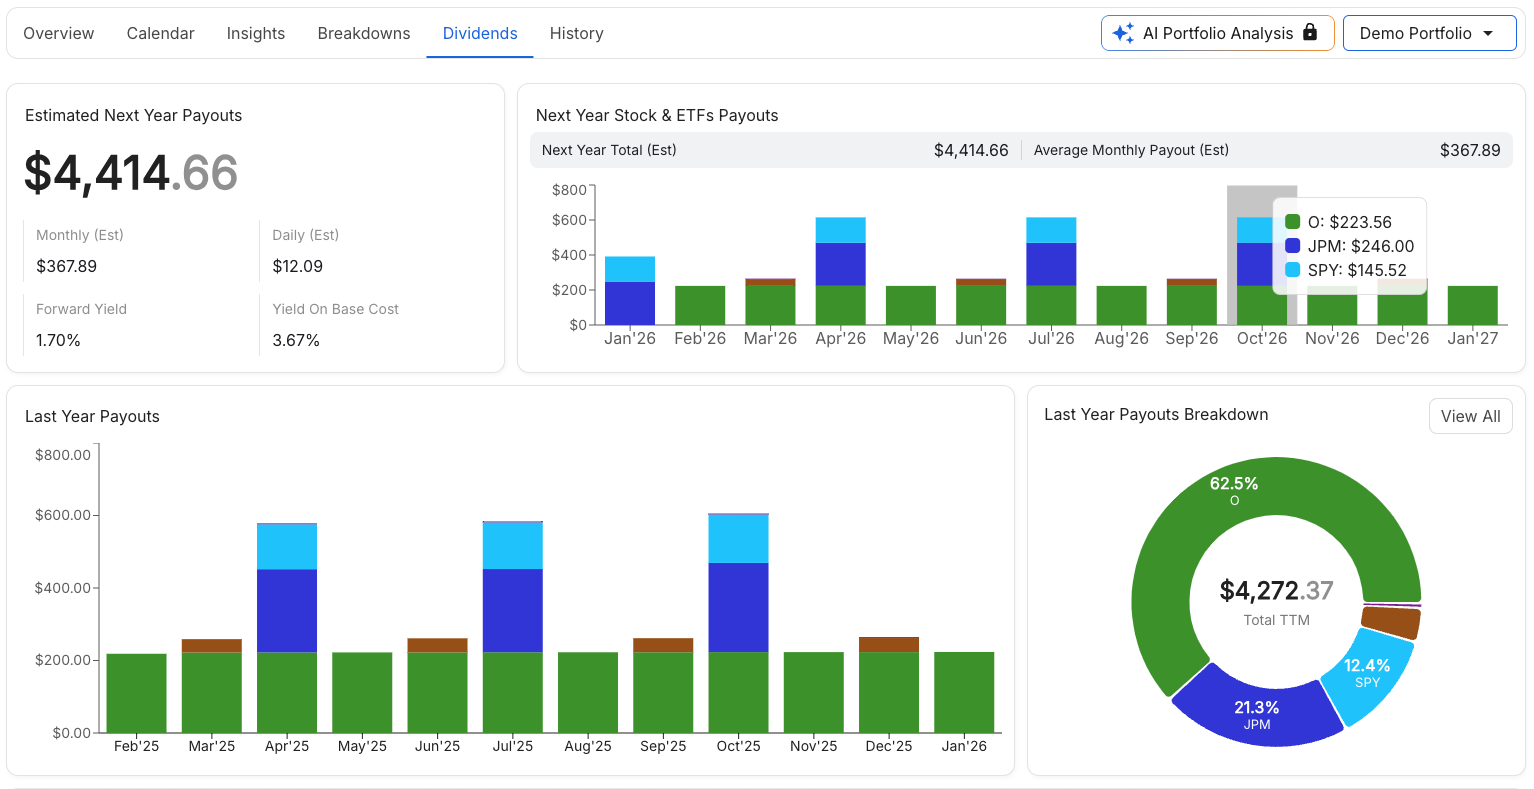
For dividend-focused investors especially, Stock Unlock's portfolio capabilities stand out. The dividend tracking features include income forecasting that projects dividend payments over the coming year, historical dividend charts going back up to 35 years, safety scores, and growth analysis, more ways to visualize and understand dividend income than anywhere else.
The platform also includes a Portfolio Health Score derived from proprietary Stock Scores, rebalancing scenarios to test allocation changes, a portfolio calendar that works seamlessly on mobile, and even AI portfolio analysis that can provide a "roast" of your holdings when you need a reality check.
Stock Unlock offers unlimited portfolios (with a practical limit around 200 that most users never approach), and the Pro plan includes one brokerage login (which can contain multiple portfolios), while Unlimited provides unlimited brokerage connections.
See Stock Unlock's portfolio dividend income analysis
Stock screening approaches reflect different philosophies
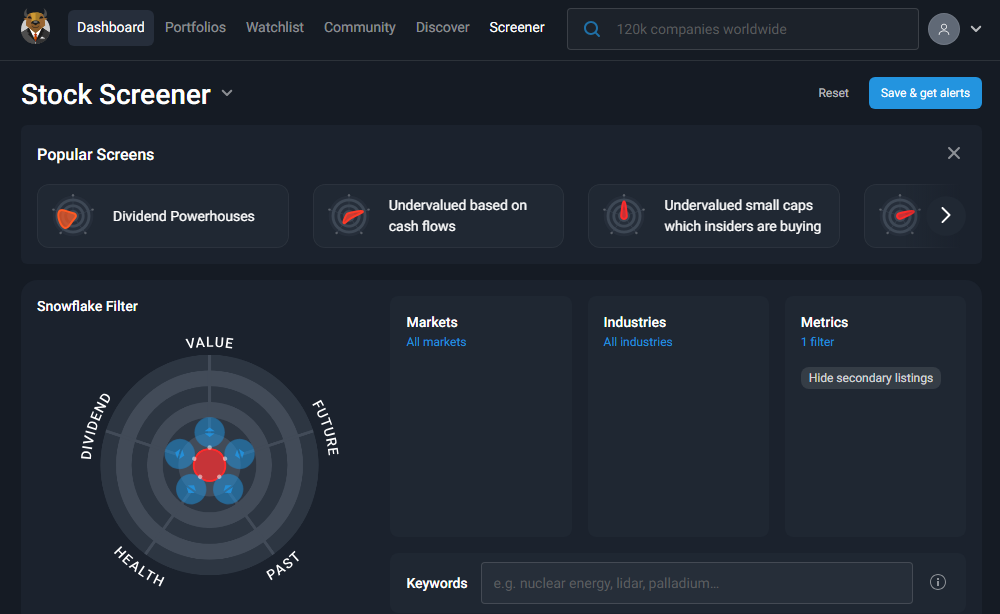
Seeking Alpha's screener integrates with its ratings ecosystem, allowing users to filter by Quant Ratings, SA Author Ratings, and Wall Street Analyst Ratings simultaneously. Pre-set screens for common strategies provide starting points for discovery. The screener covers numerous metrics but remains primarily focused on US equities.
Simply Wall St's screener leverages its visual approach, allowing users to filter by Snowflake scores across the five key dimensions.
Users can also filter by traditional metrics like P/E ratio, dividend yield, and market cap. The platform offers curated "Investing Ideas" collections organized by themes (like AI stocks or dividend powerhouses) that serve as pre-built screens. However, user feedback suggests the screener can be unintuitive for complex searches, and free users face significant limitations.
Stock Unlock's advanced stock search provides 85+ filters covering fundamental metrics, dividend data, and proprietary Stock Scores.
The industry-calibrated scoring is particularly valuable, as it accounts for the fact that healthy metrics vary significantly between sectors (what's "good" for a bank differs from what's "good" for a software company). The screener covers over 100,000 stocks across 70+ global exchanges, with 100,000+ fully scored.
For new users, presets and easy-click starter screens help you dive in immediately without getting overwhelmed. Paid users can save favorite searches for one-click re-application. It's powerful enough for serious investors running complex fundamental screens, yet accessible enough for beginners who are still learning what metrics matter.
Try the Stock Unlock screener free
Data depth and accuracy matter for long-term decisions
Seeking Alpha offers Premium subscribers access to 10 years of financial statements and earnings call transcripts covering approximately 4,500 company calls per quarter, with audio versions often available. Users should verify critical information with official SEC filings.
Simply Wall St provides Premium users with 10 years of historical financial statements, with analysis updated daily and last-update timestamps clearly displayed. However, the automated valuation calculations rely on analyst forecasts and standardized assumptions that may not capture company-specific factors.
Stock Unlock takes data accuracy seriously, with all financials reviewed by CPAs and standardized according to GAAP standards.
The platform's notable advantage is data depth: Premium plans provide up to 35 years of historical financials, enabling analysis across multiple market cycles. This extended historical view provides context that shorter time frames simply cannot match.
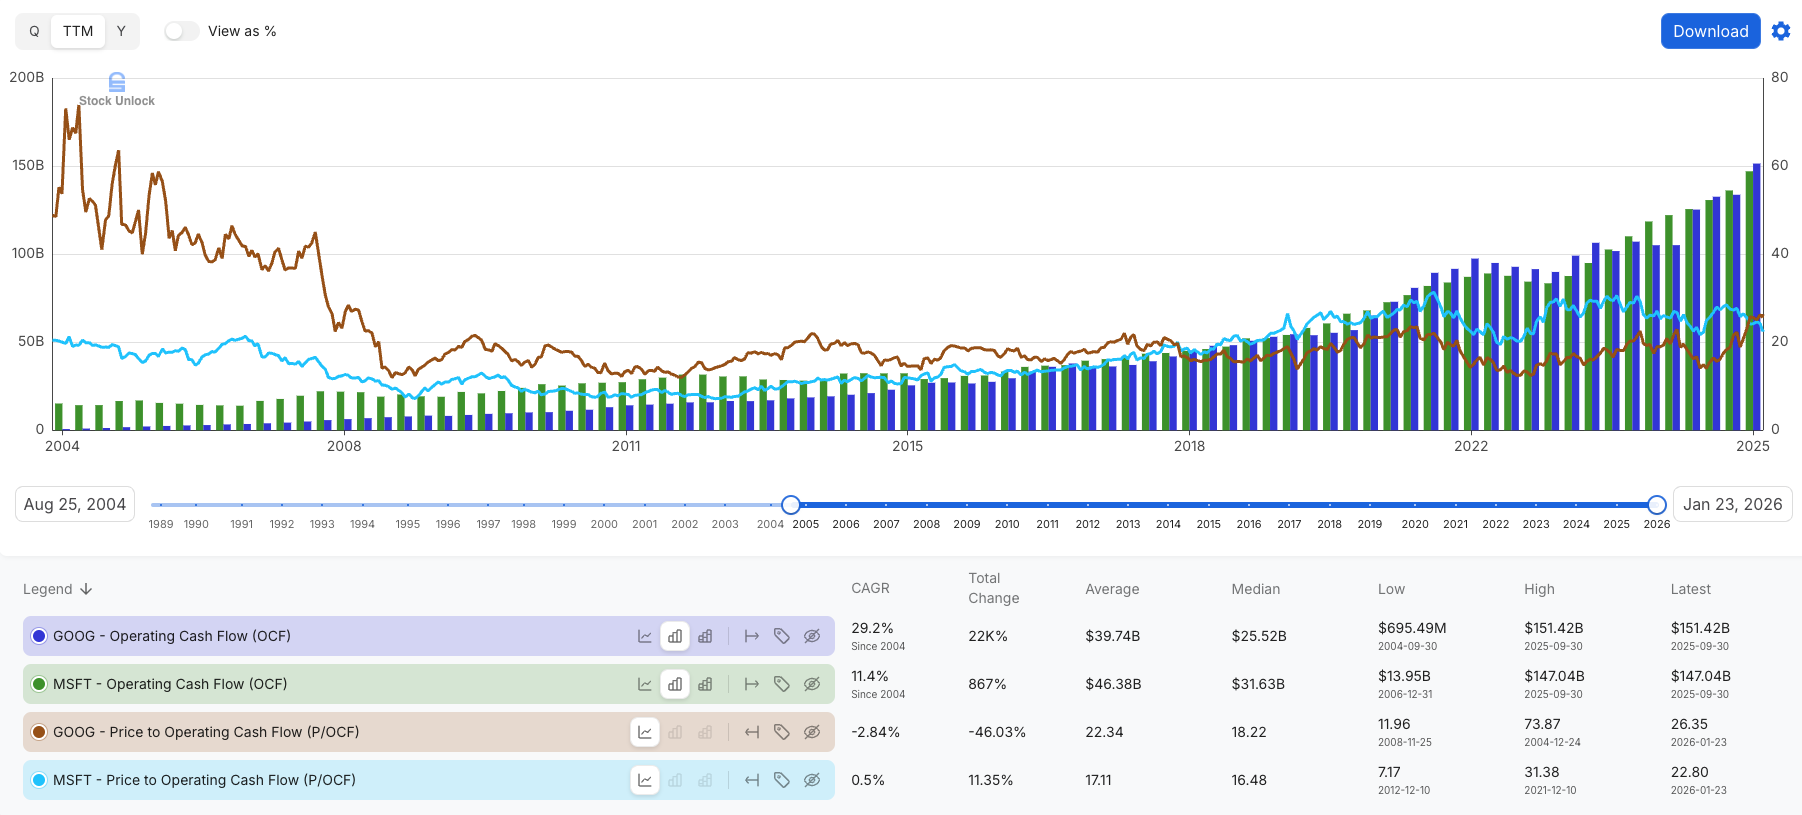
Try Stock Unlock's data tools free
Seeking Alpha vs Simply Wall St vs Stock Unlock: Which should you choose?
The best platform depends on your investment style, experience level, and what you hope to accomplish.
Choose Seeking Alpha if:
- You enjoy reading diverse analyst opinions and participating in investment community discussions
- You want access to thousands of investment ideas across the full spectrum of bullish to bearish perspectives
- You're an experienced investor comfortable filtering through varying content quality to find valuable insights
- You have the budget for premium subscriptions ($299 to $2,400+ per year depending on tier) and manage a portfolio large enough to justify the expense
- Coverage of under-followed stocks and access to earnings transcripts matter to your strategy
Explore Seeking Alpha's community-driven approach with their limited free tier.
Choose Simply Wall St if:
- You're a visual learner who grasps information better through graphics than text or numbers
- You want a quick, standardized way to get a visual overview of company fundamentals
- You're testing the waters with investing and find traditional financial statements intimidating
- You value visual design and are willing to accept some simplification and tier restrictions in exchange for accessibility
- International stock coverage beyond US markets matters to your strategy
See how Simply Wall St visualizes company fundamentals with their free plan.
Choose Stock Unlock if:
- You're an experienced investor tired of juggling multiple tools and want to consolidate into one complete platform
- You're a new investor who has decided that building a portfolio matters, and you want to learn the right way from day one
- You value understanding the "why" behind financial metrics, not just seeing the numbers
- You want institutional-quality data depth (up to 35 years of history) at an accessible price point
- You're looking for a non-predatory environment where the platform succeeds when you succeed, not when you trade more or upgrade tiers
- You want to try before you buy with a 15-day free brokerage connection and a 30-day money-back guarantee
Stock Unlock serves two audiences particularly well: experienced investors who have been using multiple analysis tools or messy spreadsheets for years and finally want relief from the complexity, and committed new investors who are convinced that proper fundamental analysis matters and want training wheels that teach them the right approach.
Start with Stock Unlock's free tools and discover what consolidated, education-integrated research feels like. Once you're in, the product speaks for itself.
The investment research landscape offers solutions for every type of investor.
Seeking Alpha provides an unmatched breadth of human perspective. Simply Wall St makes fundamental analysis visually accessible. But for investors who want to truly understand what they're investing in, and why, Stock Unlock's combination of powerful analysis, exceptional data depth, and integrated education offers something neither competitor can match: a complete investing toolkit that grows with you, built by frustrated investors who refuse to accept the status quo.
Ready to see the difference? Create your free Stock Unlock account and experience what investment research should feel like.
Try Stock Unlock Free
No credit card required. 15-day free brokerage trial. 30-day money-back guarantee on paid plans.
Get Started for Free