Score ETFs. Compare Funds.
Invest Smarter.
Picking an ETF shouldn't mean choosing the cheapest familiar name and hoping for the best. Score and compare 50,000+ funds across 70+ global exchanges.
See What Actually Sets ETFs Apart
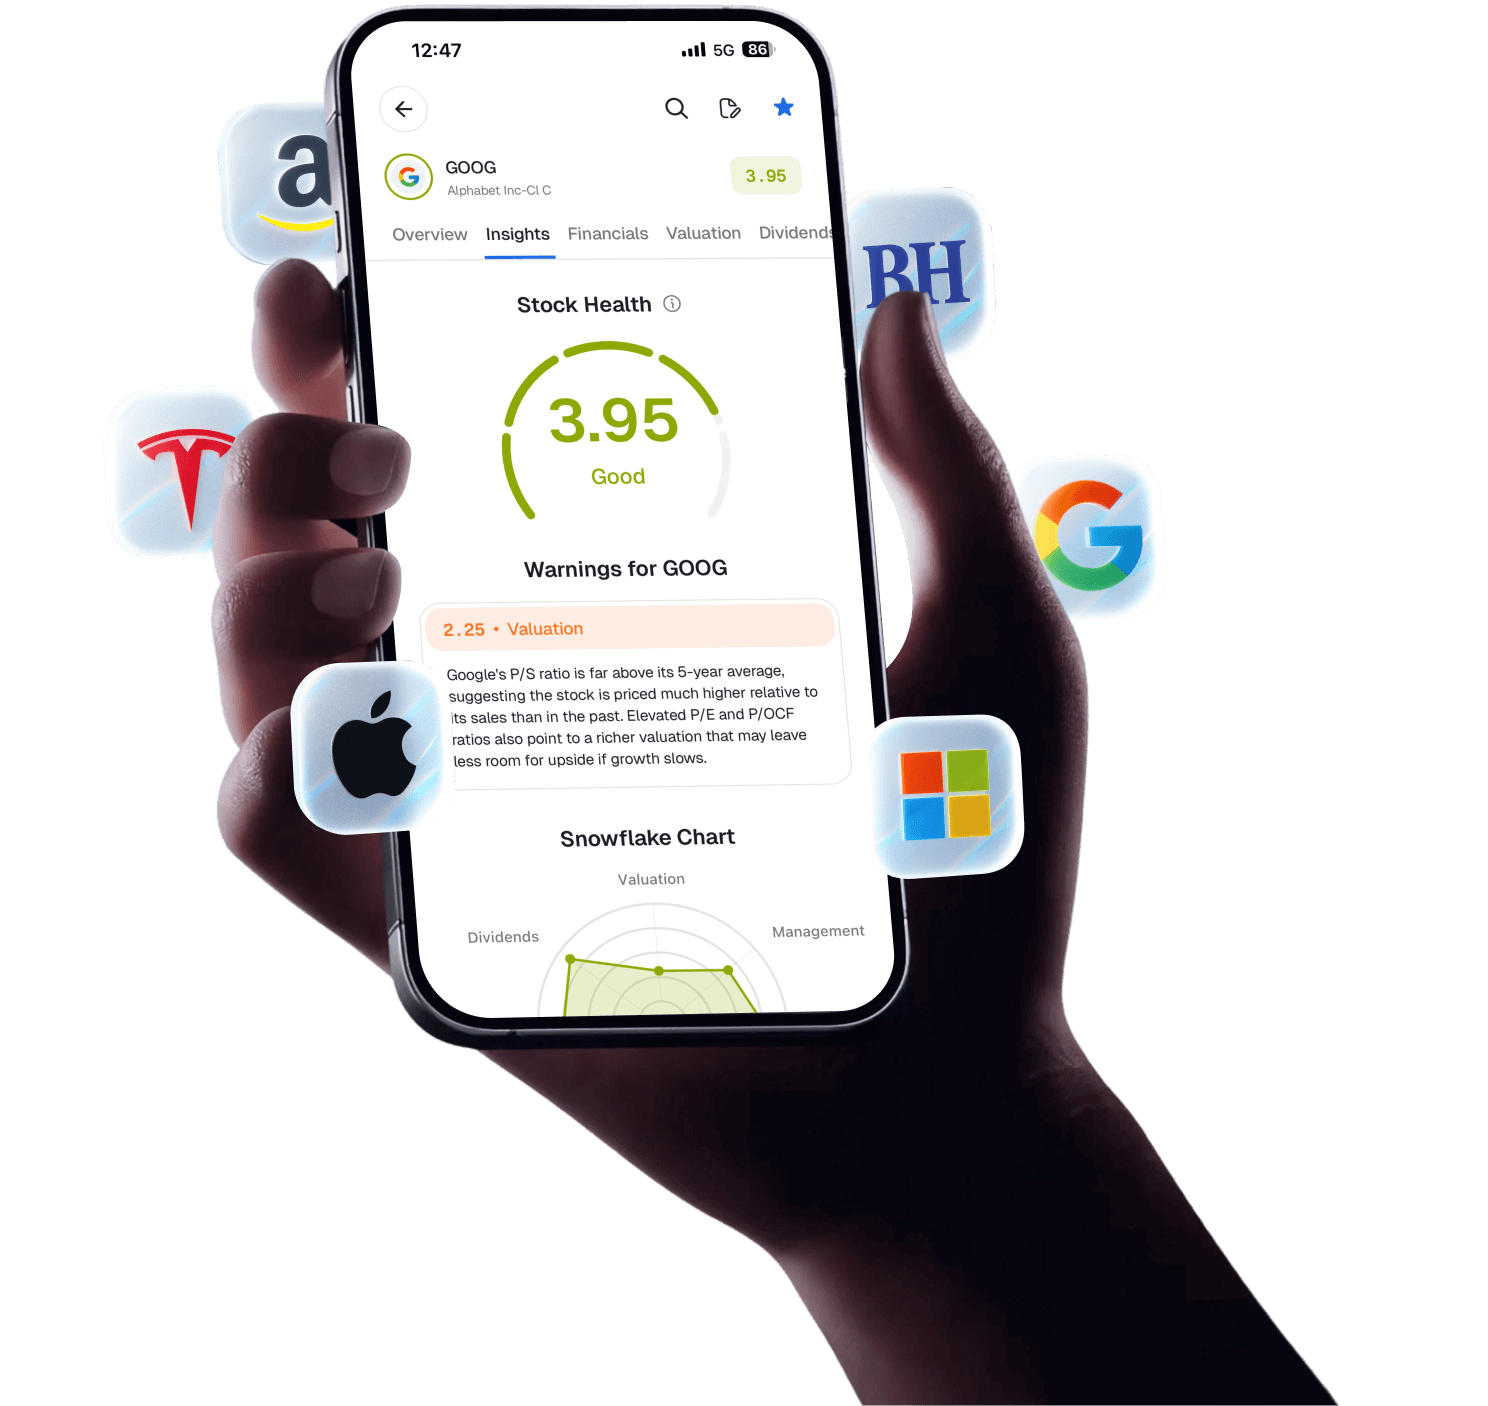
Our proprietary ETF Scores rate every fund from 1 to 5 based on the fundamental quality of the stocks it holds, scored across categories like Valuation, Profitability, and Financial Health. A separate Expense Ratio Rating (A through E) shows how each fund's fees compare.
See those differences at a glance.
See What You Actually Own
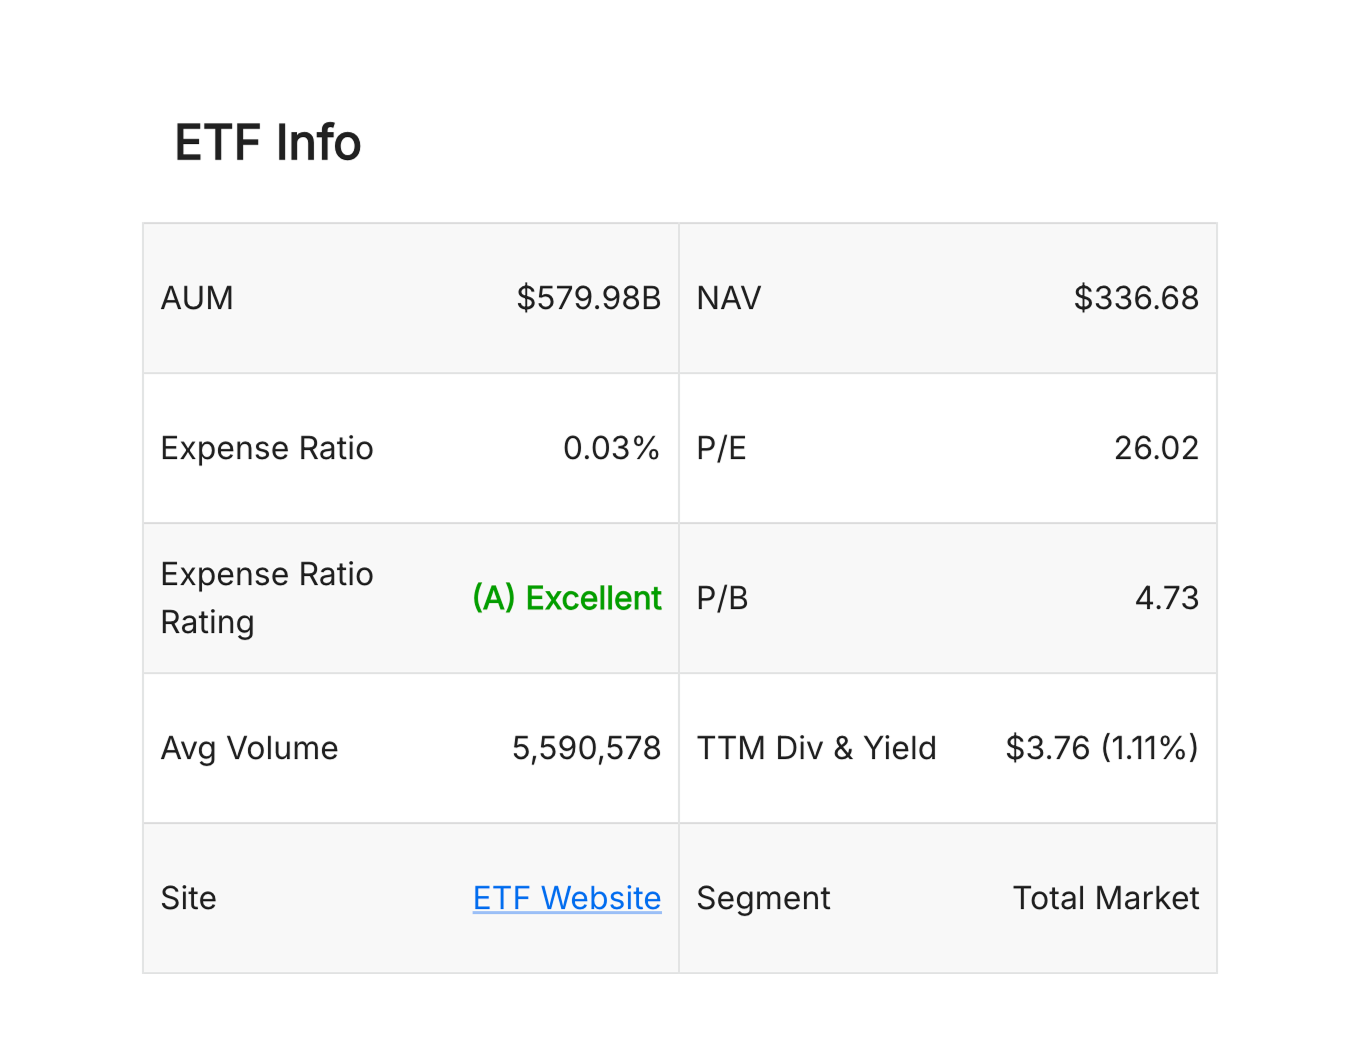
Most investors buy an ETF and never look inside. Our ETF research tools break down every fund (holdings, sector allocation, geographic exposure, and expense ratios) so you know exactly what you're paying for.
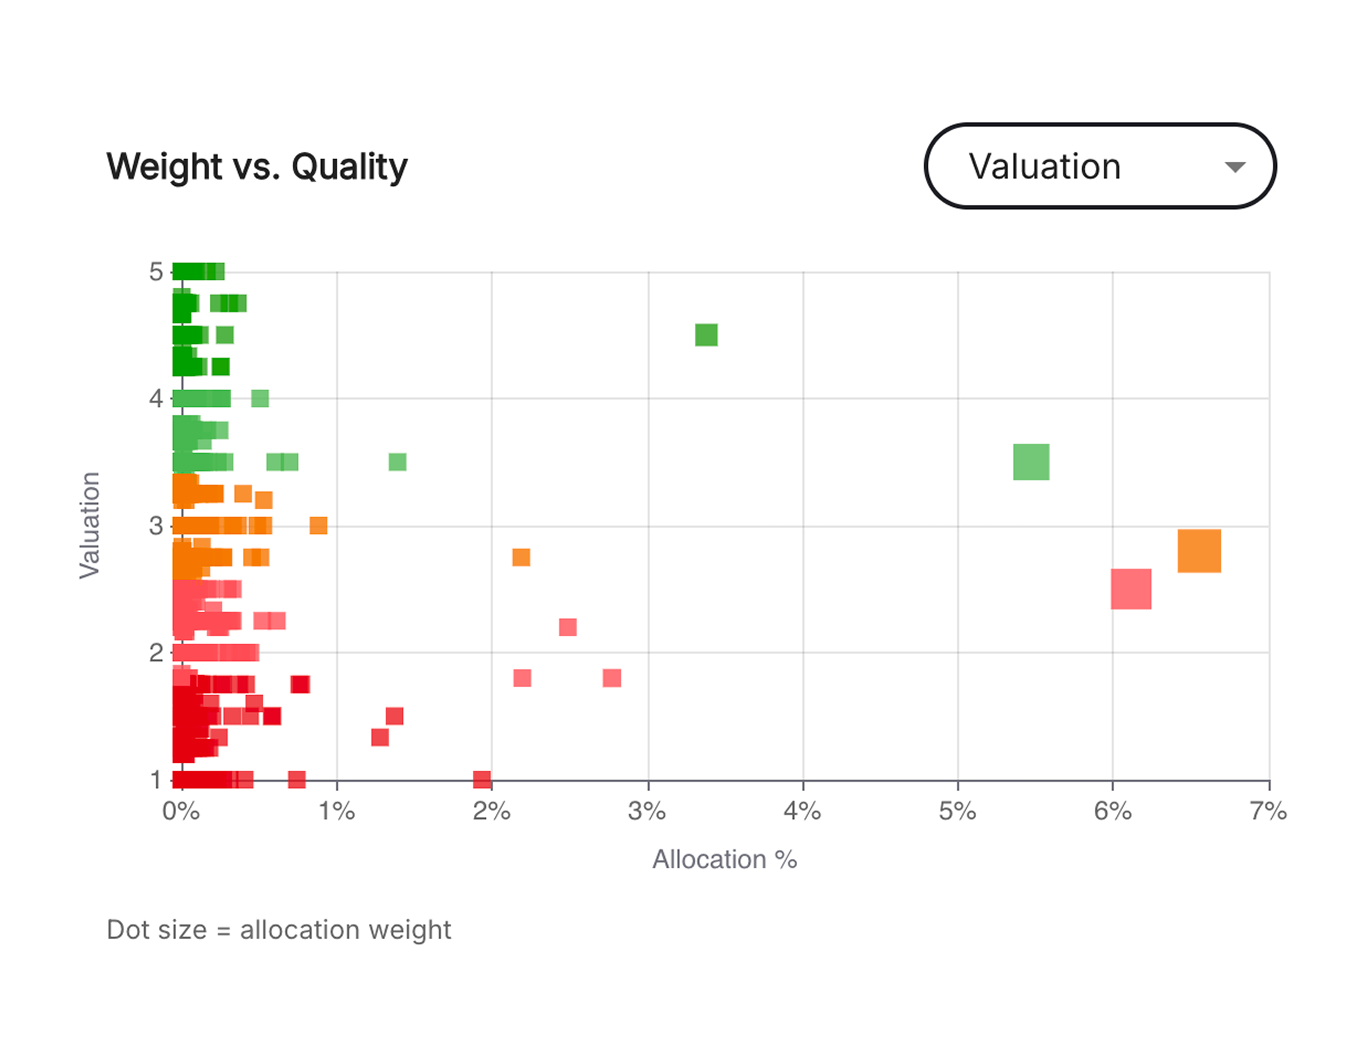
Every holding shows its individual stock score, so you can spot the strongest and weakest positions at a glance.
Find the Right ETF in Seconds
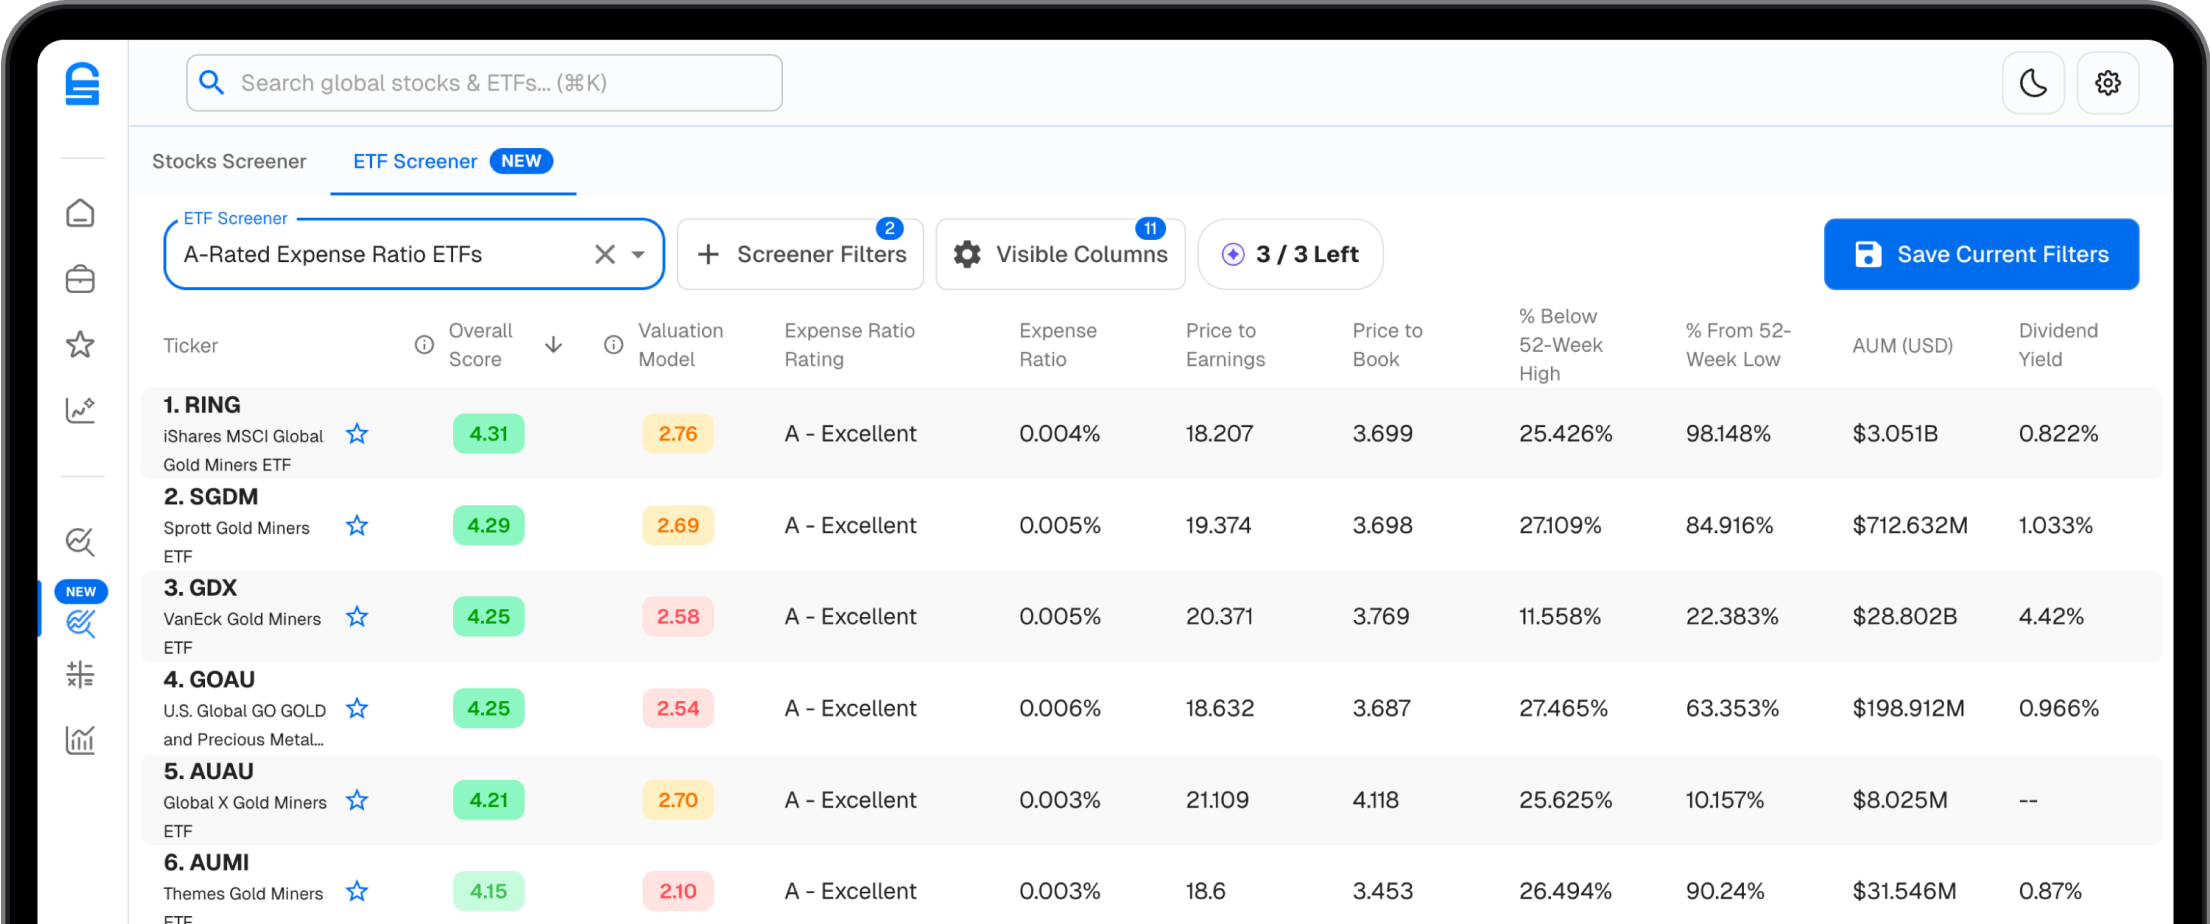
Filter 50,000+ ETFs by what actually matters: ETF Scores, Expense Ratio Ratings, dividend yield, holdings, and 35+ other metrics. Toggle leveraged, inverse, covered call, and put-write ETFs in or out, your call.
Start with pre-built screens (A-rated expense ratios, top dividend ETFs, country-focused), or build your own from scratch.
Why ETF Investors Need Better Tools
The Old Way
-
Paralysis by Choice
10 near-identical S&P 500 ETFs and no clear way to compare them.
-
Hidden Fee Drag
Paying 0.50% in fees when a 0.03% alternative holds the exact same stocks.
-
Blind Diversification
Owning 5 ETFs that all hold the same top 10 stocks without realizing it.
The Stock Unlock Way
-
Scored and Ranked
ETF Scores give every fund a clear 1-5 rating so you can compare with confidence.
-
Fee Transparency
Expense ratios front and center so you never overpay for the same exposure.
-
Full Holdings Breakdown
See every position, sector, and country inside any ETF.
Explore the World's Most Popular ETFs
Explore scores, holdings, and expenses for the ETFs that matter most to your portfolio.
ETFs Are Just the Beginning
Explore tools designed for every type of investor
Portfolio Tracker
Sync your brokerage and track all your ETFs, stocks, and funds in one place
Dividend Investing
Track income, forecast payouts, and find the safest dividend stocks
Stock Scores
Data-driven 1-5 ratings for every stock and ETF: valuation, growth, dividends, and more
ETF Investing FAQ
Common questions from ETF and index fund investors
What are ETF Scores and how do they work?
ETF Scores are Stock Unlock's proprietary 1-5 ratings for exchange-traded funds. Each score is a weighted average of the fundamental quality of the stocks the ETF holds, evaluated across 7 categories: Valuation, Profitability, Financial Health, Growth, Dividends, Management, and Analyst. A score of 5 means the ETF holds fundamentally strong companies across these dimensions.
Separately, every ETF gets an Expense Ratio Rating (A through E) that grades how competitive its fees are compared to similar funds. Together, ETF Scores and the Expense Ratio Rating help you compare similar ETFs (like competing S&P 500 funds) on both the quality of what they hold and what they charge.
What can I see about an ETF on Stock Unlock?
Search for any ETF and you'll see its ETF Score alongside expense ratio, Expense Ratio Rating, holdings breakdown, sector allocation, and geographic exposure. Each holding is listed with its weight and individual stock score so you can evaluate the quality of what's inside.
The scores tab shows a heatmap of all holdings across 7 fundamental categories, plus concentration alerts if the fund is top-heavy. This is especially useful when evaluating funds that look similar on the surface but hold very different underlying stocks.
How does Stock Unlock analyze ETF holdings?
For every ETF, Stock Unlock breaks down the full list of holdings with each position's weight, sector, and country. You can see exactly what you own inside a fund, including sector allocation charts and geographic exposure maps.
Each holding also shows its individual stock score, so you can quickly identify the strongest and weakest positions inside any fund. Concentration alerts flag when an ETF is heavily weighted toward a small number of stocks.
Does Stock Unlock cover international ETFs?
Yes. Stock Unlock covers 50,000+ ETFs across 70+ global exchanges. Whether you're looking at US-listed funds like SPY and VTI, European ETFs, Australian ETFs, or emerging market funds, you'll get the same depth of analysis: ETF Scores, holdings breakdowns, expense comparisons, and portfolio integration.
If you hold international ETFs through a brokerage, you can connect your account and see everything in one unified portfolio view. Stock Unlock supports 30+ brokerages worldwide through our Snaptrade integration.
Is Stock Unlock free for ETF investors?
Yes. You can view any ETF's data, ETF Scores, Expense Ratio Rating, holdings breakdown, and track a portfolio without paying. Free accounts also include a 15-day trial of brokerage connection for automatic portfolio syncing.
Premium plans unlock extended historical data (up to 35 years on Unlimited), full access to all Stock Score categories, and permanent brokerage connections. All plans include a 30-day money-back guarantee.
How do expense ratios affect long-term ETF returns?
Expense ratios compound against you over time, just like returns compound for you. A 0.50% difference in expense ratio might seem small, but over 20 years on a $100,000 investment earning 8% annually, that gap costs you roughly $24,000 in lost returns. For ETFs tracking the same index, the cheaper fund almost always wins long-term.
Stock Unlock shows expense ratios prominently on every ETF page. The Expense Ratio Rating (A through E) is separate from ETF Scores, giving you a quick read on whether a fund's fees are competitive within its asset class.
Still have questions?