Complete Stock Research
in One Place
Stop tab-switching. Get 35 years of financials, valuation charts, exclusive scores, and analyst insights in a single, powerful platform.
170,000+ stocks across 70+ global exchanges
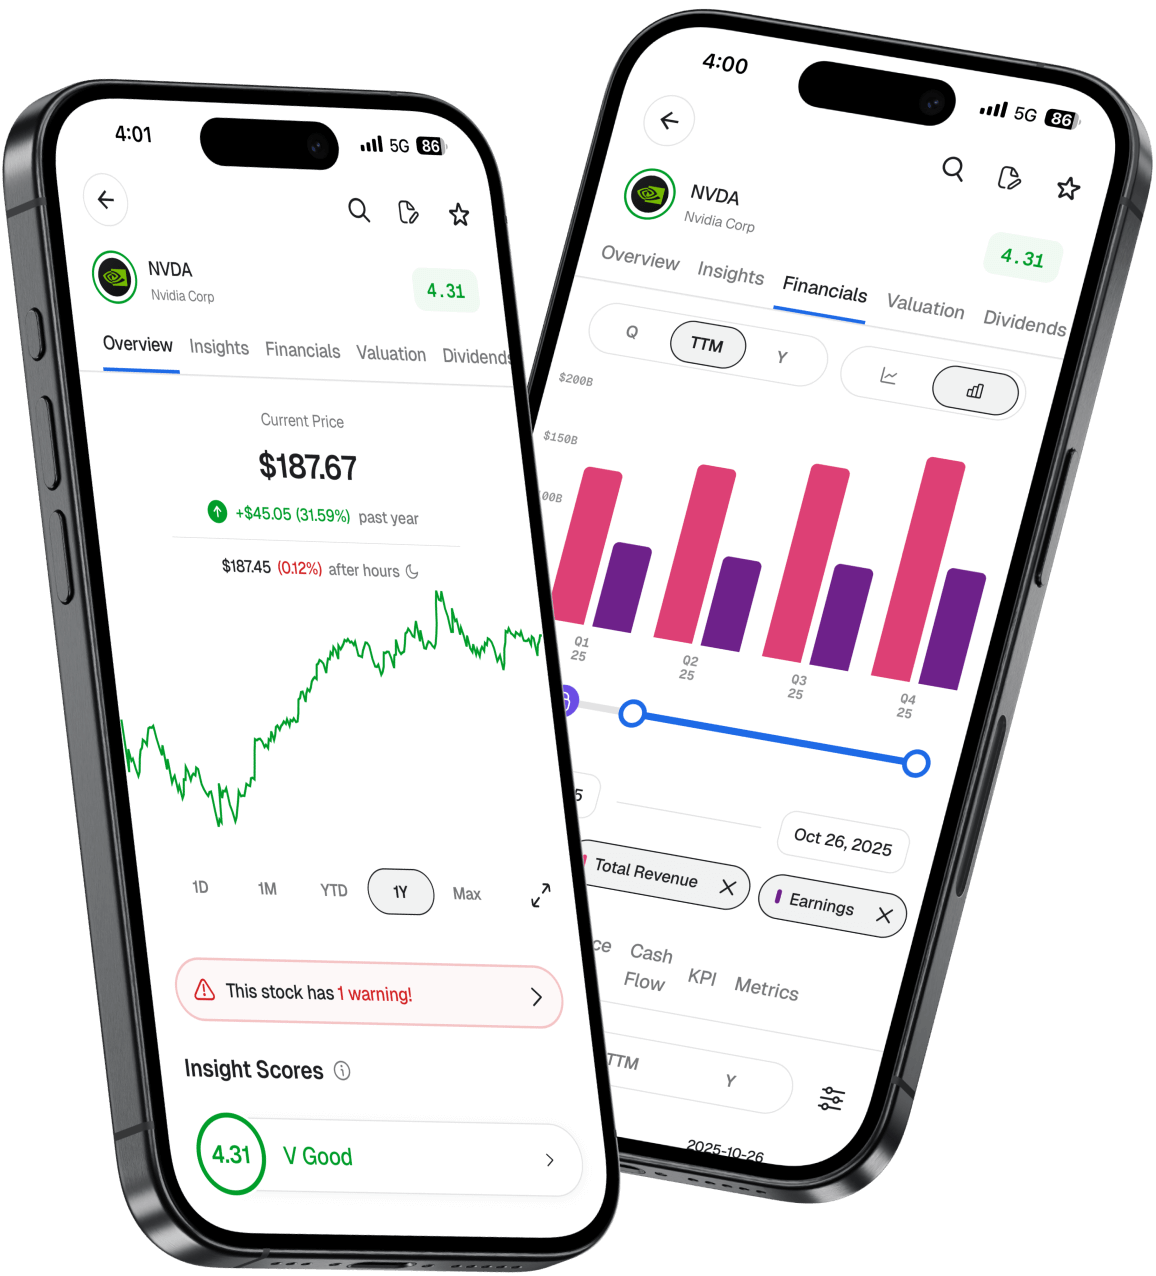
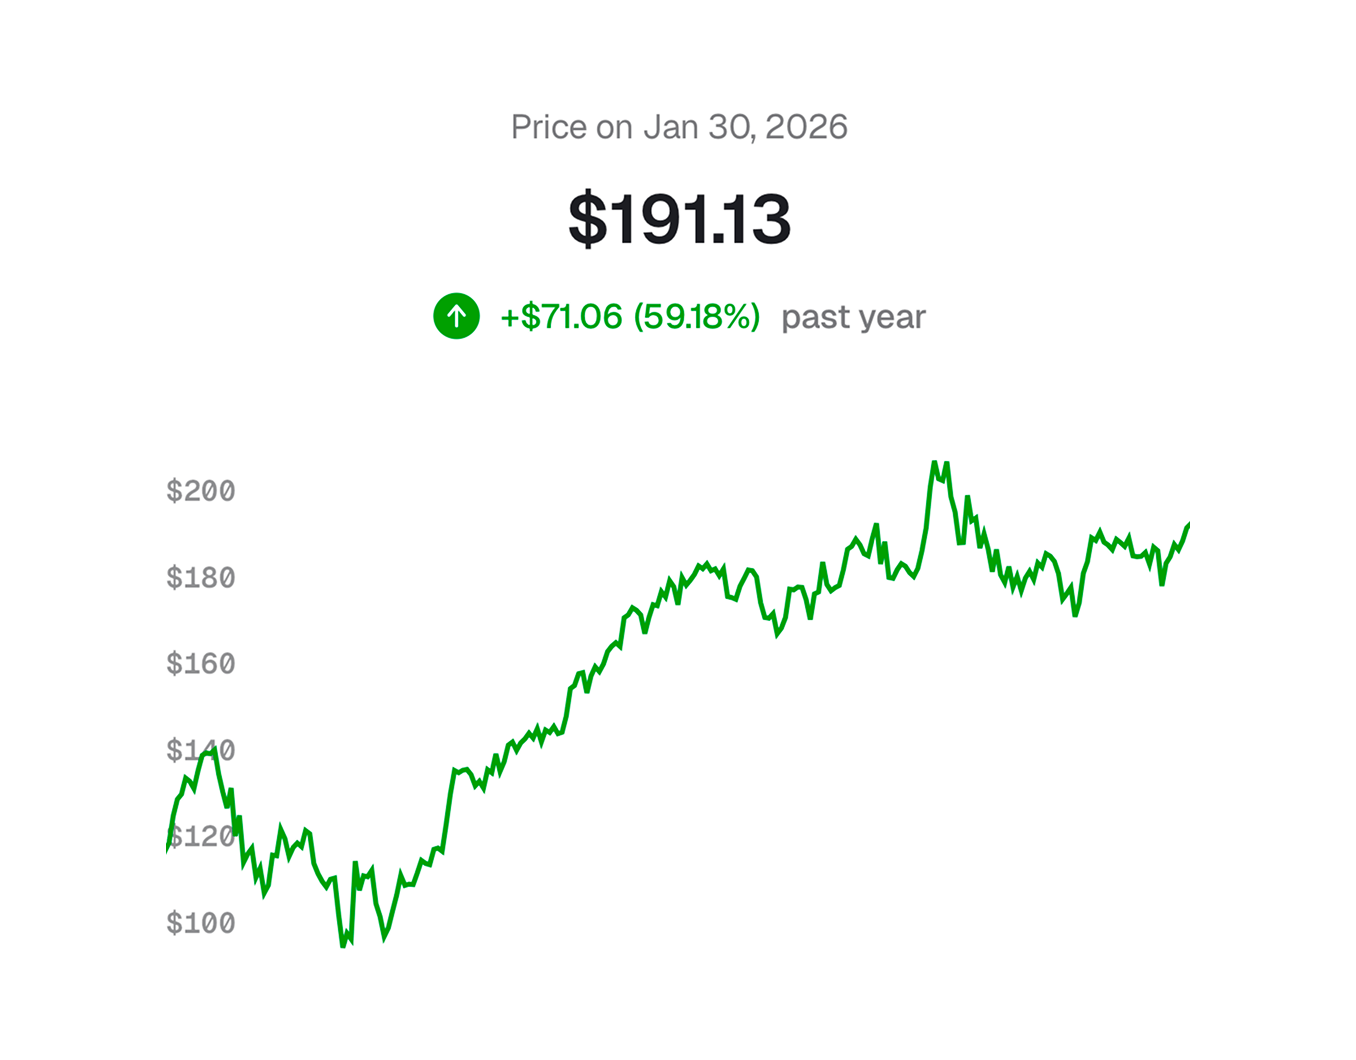
The Big Picture, Instantly
Get the full story on any stock in seconds. Price charts with key events, essential metrics, and breaking news, all in one view!
- Price Charts — With buy/sell indicators
- Key Metrics — P/E, market cap and more at a glance
- Real-time News — Aggregated from trusted sources
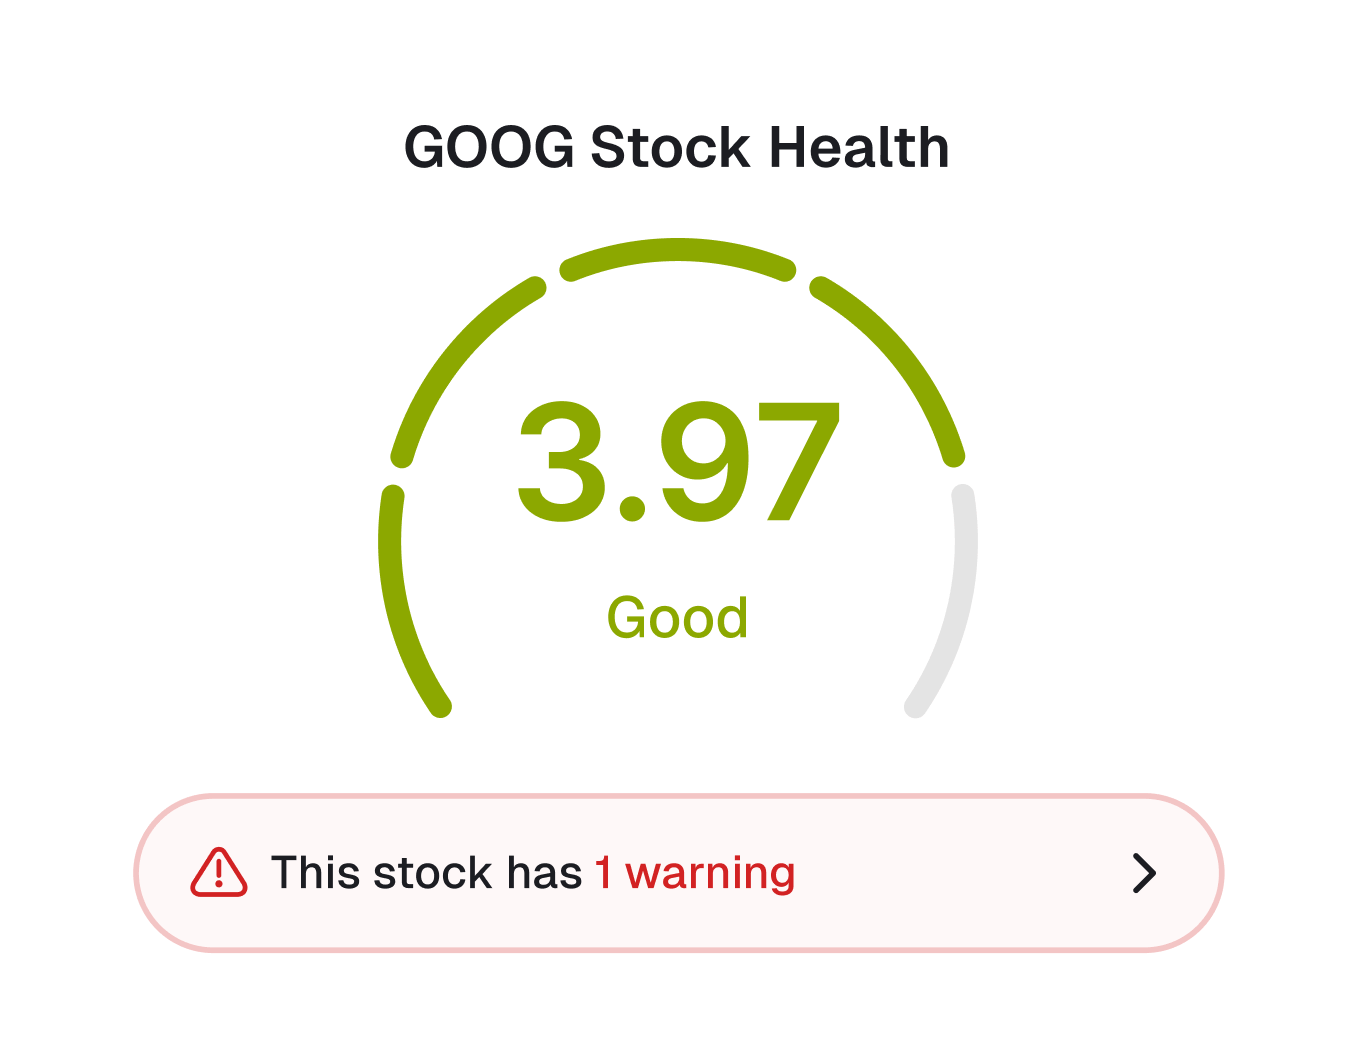
Instant Fundamental Health Check
Skip the spreadsheets. Our proprietary scores are calibrated per-industry, validated against historical data, and refined over years. See a stock's quality in seconds.
- Valuation — See how a stock is valued with our proprietary scores
- Score Breakdowns — Understand the "why" behind every score
- Warnings — Alerts for when critical issues are detected
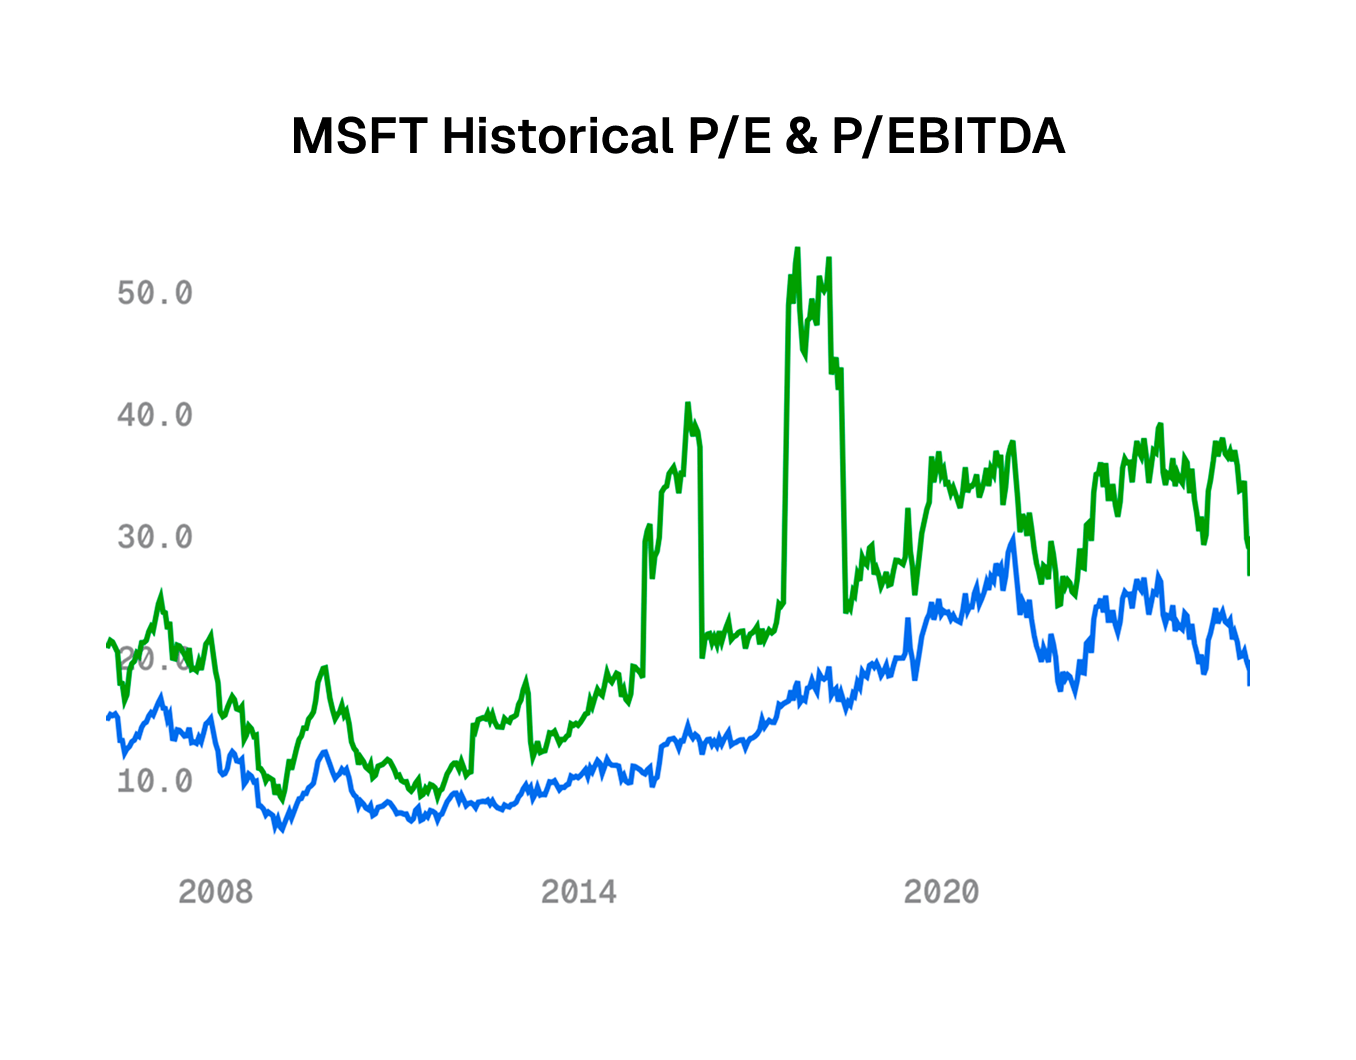
Is It Worth the Price?
Understand if a stock is cheap or expensive relative to its own history. Analyze valuation multiples across decades of data to find the best entry points.
- Historical Ratios — P/E, P/S, P/FCF over time
- Current vs. 5Y Avg — Price vs. historical averages
- Multiple Timeframes — Compare valuation metrics across years
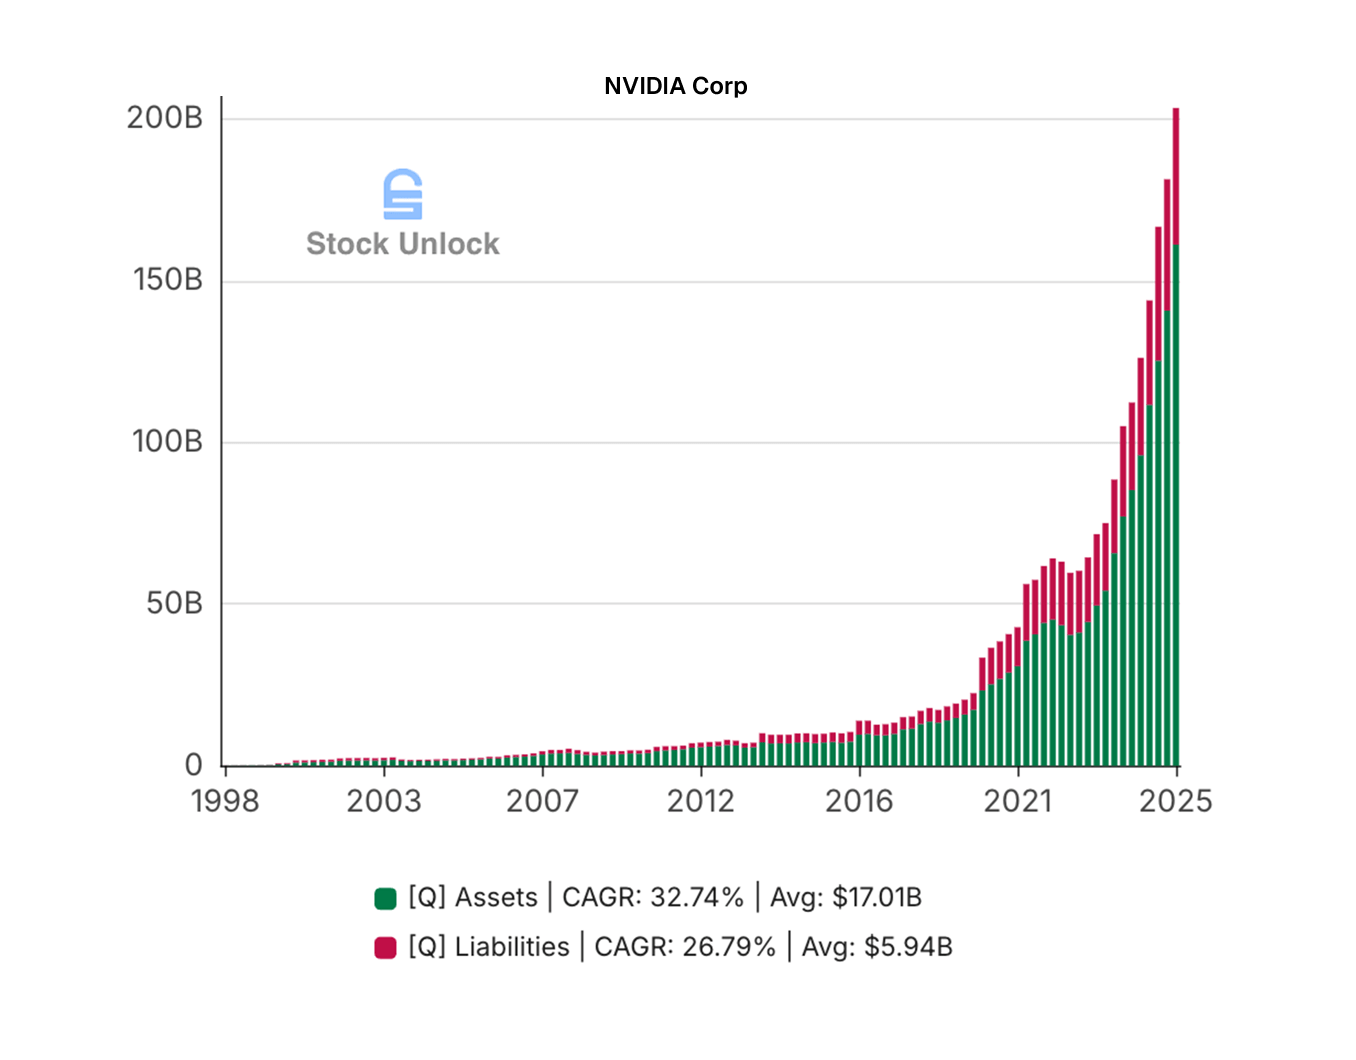
Detailed Financials for 35+ Years
Dig deep into the numbers. Access 100s of metrics across income statements, balance sheets, cash flows, and KPIs—with visualized data for every line item.
- 35 Years of History — Data through every market cycle
- 100s of Metrics — IS, BS, CF, KPIs, and more
- Visual Charts — Charts for every single financial metric
Deep Fundamental Analysis
Everything you need to analyze dividends, analysts, and insiders.
Dividend Insights
Track upcoming payouts, view projected income, and see dividend safety scores at a glance.
See Dividend ToolsAnalyst Consensus
Know what Wall St. thinks. Aggregated Buy/Sell ratings and 12-month price targets from top firms.
See Analyst RatingsInsider Activity
Follow the smart money. See exactly when CEOs and executives are buying or selling their own stock.
See Insider MovesEverything You Need to Decide
We built the toolkit we always wanted. Powerful, intuitive, and distraction-free.
Create unlimited lists. Sort by price, change, or any fundamental metric like P/E or Div Yield.
Headlines from major sources, filtered for your stocks. Zero noise, just relevant updates.
Write notes on any stock. Save your thesis, track your thoughts, and review them later.
See exactly what a company does, including their industry and core business segments.
Earnings dates, ex-dividend dates, and splits. Know exactly what's coming up next week.
Tap on any metric to see its definition and formula in plain English.
Research Without Borders
We don't just track the S&P 500. Access data for 170,000+ stocks across 70+ global exchanges.
Frequently Asked Questions
Common questions about stock research with Stock Unlock
What is Stock Unlock?
Stock Unlock is an all-in-one stock research platform that covers 170,000+ stocks and ETFs across 70+ global exchanges. It combines Stock Scores, 35+ years of financial data, a DCF fair value calculator with 7 valuation metrics, a stock screener with 85+ filters, and portfolio tracking with 30+ brokerage integrations into a single platform. Founded in 2020 and backed by Y Combinator (W22), Stock Unlock serves thousands of investors in 100+ countries. Unlike brokerages that profit from trading activity, Stock Unlock is a research-focused platform that profits when investors make better decisions.
What financial data and metrics are available?
Stock Unlock provides hundreds of financial metrics spanning income statements, balance sheets, cash flow statements, and KPIs, with up to 35+ years of historical data. Every metric includes interactive charts so you can visualize trends over time. The platform also aggregates analyst consensus ratings, insider transaction activity, and dividend history including payout ratios, ex-dates, and growth rates. All data is sourced from institutional-grade providers used by hedge funds and professional analysts.
How do Stock Scores work?
Stock Scores are proprietary ratings that evaluate stocks across 7 categories: Valuation, Growth, Profitability, Financial Health, Dividends, Management, and Analyst sentiment. Each score is calibrated per-industry, so a tech company is benchmarked against other tech companies rather than utilities or banks. When warranted, Stock Unlock's engineering team builds custom scoring adjustments for individual stocks to account for edge cases that algorithms alone might miss. Scores use a 1-5 scale with visual color coding: green signals strength, red signals caution. Every score includes a detailed breakdown showing which specific metrics drove the rating, plus automated warnings for critical issues like declining revenue or unsustainable dividend payouts.
What stock exchanges and markets does Stock Unlock cover?
Stock Unlock covers 170,000+ stocks and ETFs across 70+ global exchanges, including NYSE, NASDAQ, LSE (London), TSX (Toronto), ASX (Australia), NSE/BSE (India), Frankfurt/Xetra, Tokyo, Hong Kong, Singapore, Euronext, and dozens more across Europe, Asia, and Latin America. International stocks receive the same depth of analysis as US stocks, including full financial statements, Stock Scores, valuation data, and dividend history. This makes Stock Unlock one of the few research platforms that treats global markets as first-class rather than an afterthought.
How is Stock Unlock different from Yahoo Finance?
Free tools like Yahoo Finance provide basic price data and limited financials, but lack deeper research tools. Stock Unlock adds proprietary Stock Scores for instant fundamental analysis across 7 categories, a DCF fair value calculator with 7 valuation metrics, a screener with 85+ filters including score-based filtering, dividend safety analysis with 35+ years of history, and unified portfolio tracking across 30+ brokerages. Stock Unlock also covers 70+ global exchanges with equal analytical depth, while Yahoo Finance's international coverage is more limited. The built-in Learn Mode explains every financial metric in plain English, making complex research accessible.
Is Stock Unlock designed for beginners or experienced investors?
Stock Unlock is built to work for both. Over half of Stock Unlock's users are experienced investors who use the platform to save time with instant Stock Scores, 35+ years of financial data, and a 7-metric DCF calculator. For newer investors, Learn Mode acts like training wheels: tap any metric to see what it means and why it matters, in plain English. Stock Scores provide instant color-coded summaries (green = strong, red = caution) so beginners can evaluate a stock in seconds without interpreting raw financial statements. The platform shows beginners where to start and saves experienced investors hours of manual research.
Does Stock Unlock include a DCF or fair value calculator?
Stock Unlock includes a fully automated DCF (Discounted Cash Flow) calculator that estimates fair value using 7 different valuation metrics: Free Cash Flow, Operating Cash Flow, Net Income, EBITDA, EBIT, Operating Income, and Book Value. The calculator pre-fills historical financial data automatically, so users can generate a fair value estimate in seconds and then adjust growth rates, discount rates, and projection periods from 1 to 10 years. It also includes Growth Decay modeling for more realistic long-term projections by gradually reducing growth assumptions over time. Pre-calculated fair value analyses are also available for popular stocks.
Where does Stock Unlock's financial data come from?
Stock Unlock licenses financial data from institutional-grade providers, the same data sources used by hedge funds and professional analysts. This includes 35+ years of historical financial statements, real-time pricing, analyst consensus ratings from major Wall Street firms, insider transaction filings, and dividend payment records. Data is updated continuously as new filings, earnings reports, and analyst revisions are published.