Historical Stock Scores
Up to 35 Years of Data
Watch how any stock scored across all 7 score categories through market cycles, crashes, and recoveries. See when the Valuation Score flagged stocks as cheap or expensive. Every score uses only data available at that moment. No hindsight.
Get Started for Free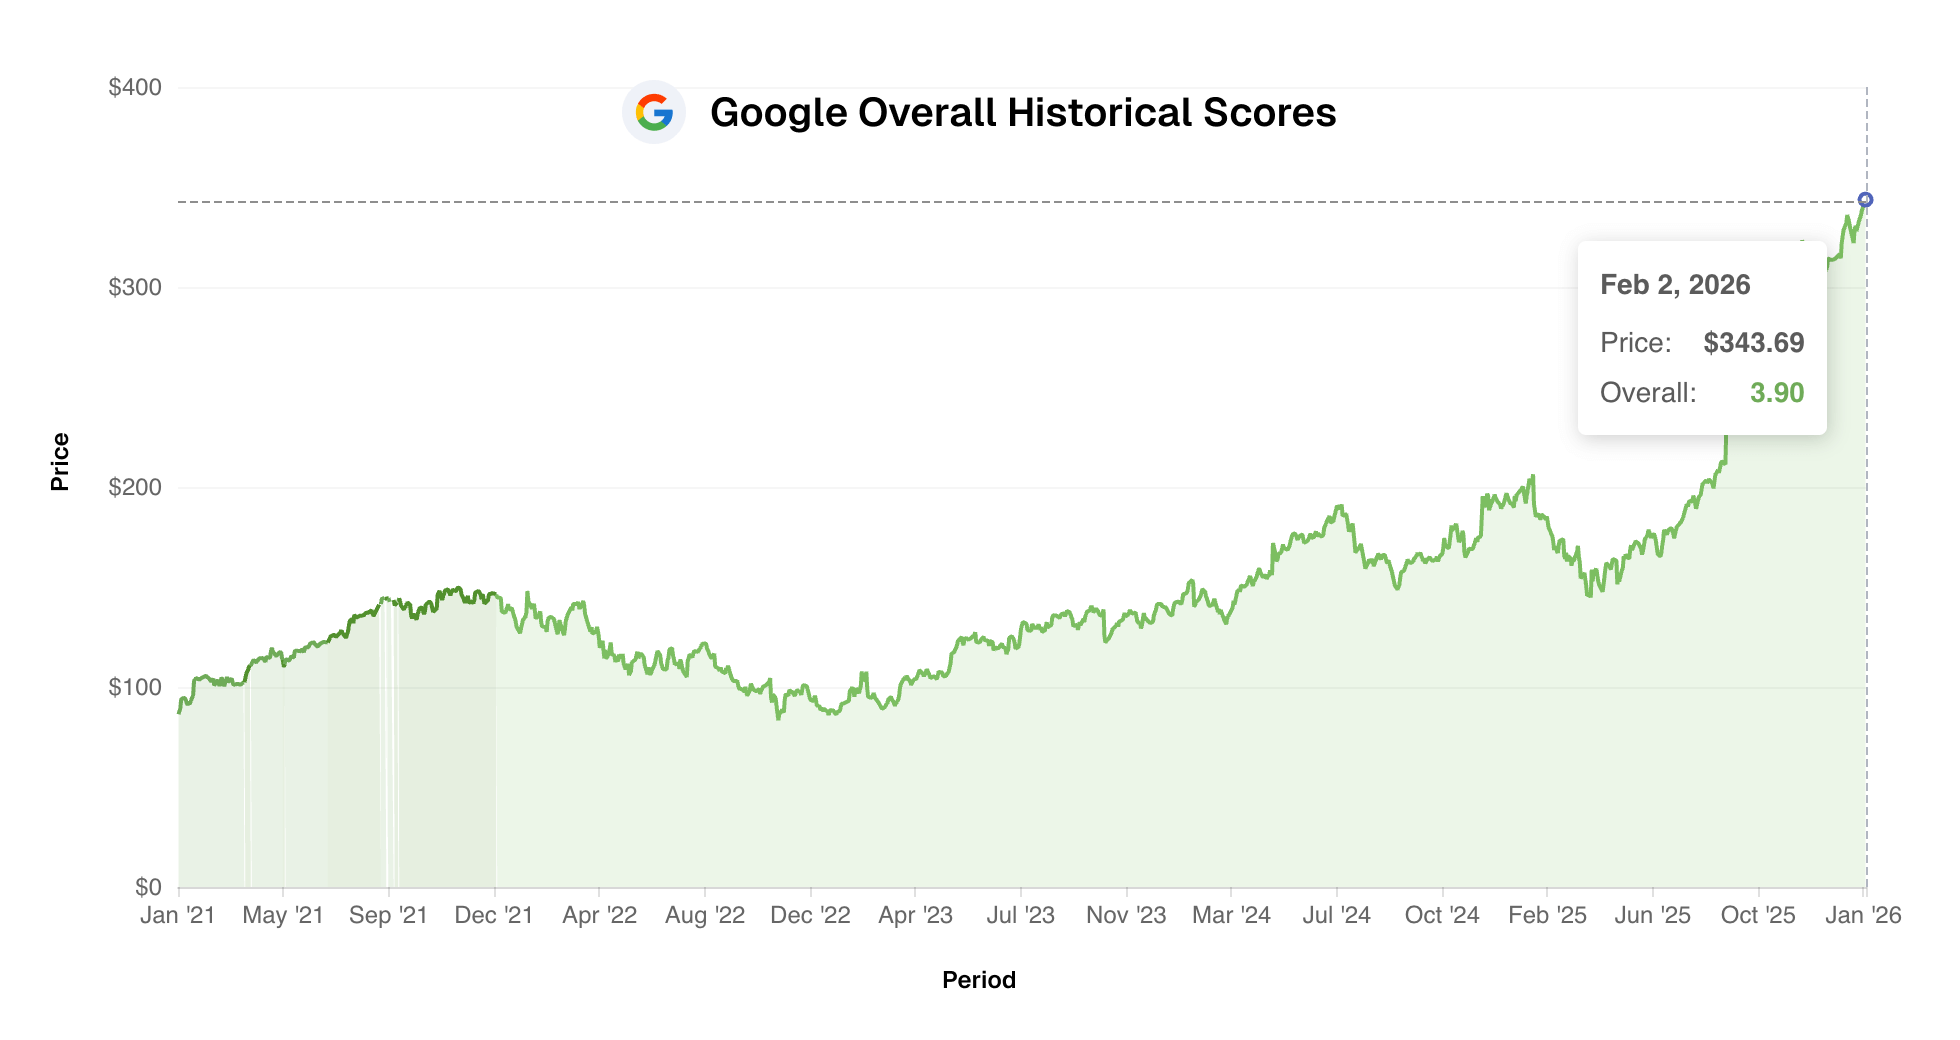

Point-in-Time Accurate
Zero look-ahead bias
Up to 35 Years of History
From recent IPOs to decades of data
Per-Stock Calibration
Metrics adapt to each company
We Locked the Time Machine
Hindsight is 20/20, but stock scores shouldn't be. When we show you a score from 2015, it only uses data that existed in 2015. That's how you test an idea honestly.
What Can You Do With Historical Scores?
Up to 35 years of point-in-time data opens up possibilities that live scores alone can't offer.
Test the Valuation Score
See when our model flagged stocks as undervalued relative to their historical norms. Backtesting, not backseat driving.
Track Fundamental Shifts
Watch how profitability, growth, and health scores changed before major price moves. See the patterns for yourself.
No Hindsight Bias
Every score uses only data that was available at that moment. See exactly what you would have seen then, not what we know now.
Backtest Any Score
Chart each score individually and see how prices moved when scores were high vs. low. Identify which signals mattered most for any stock.
Overall Score
Overall Fundamental Health
The composite score across all 7 equally weighted categories. See how the overall picture evolved through market cycles and earnings shifts.
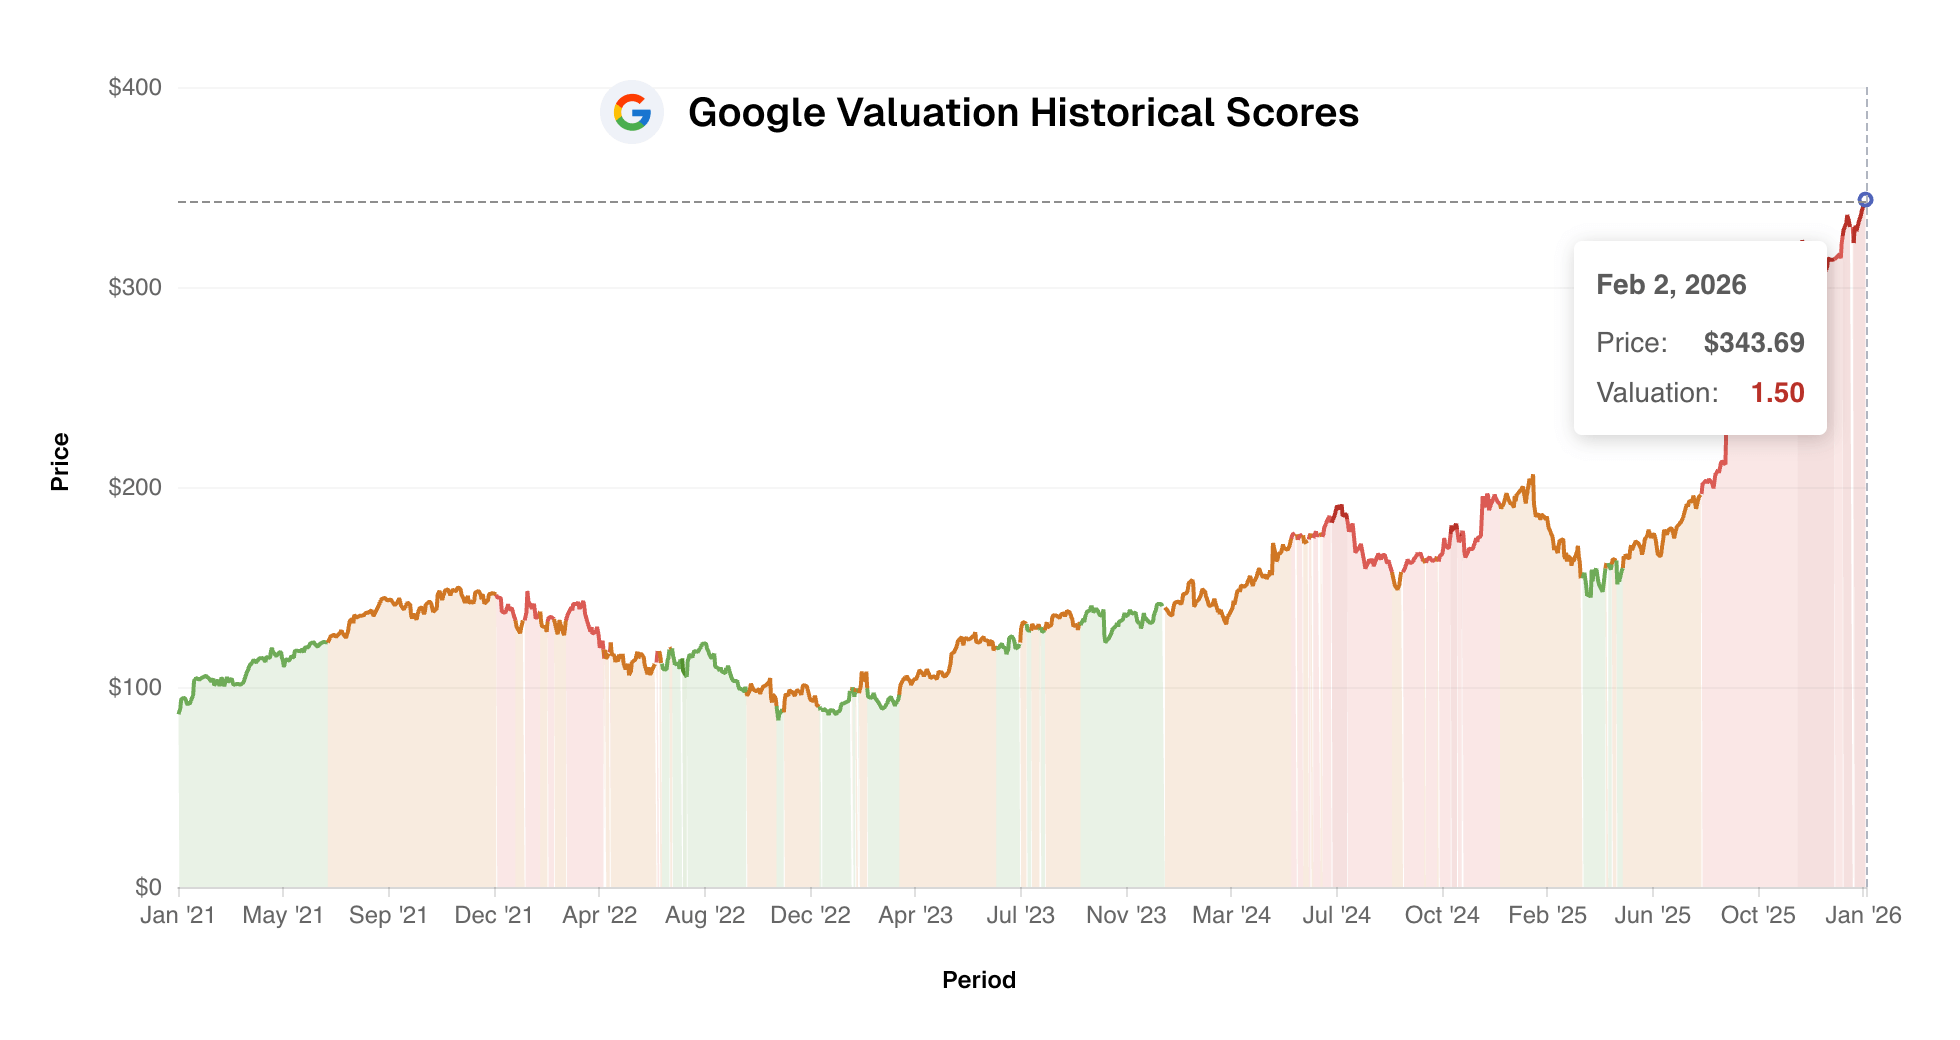
Valuation Score
Undervalued vs. Overvalued
Analyzes multiples like P/E and earnings yield, picking the most relevant ones for each stock automatically. See when our model flagged a stock as over- or undervalued relative to its own history.
Learn about the Valuation ScoreGrowth
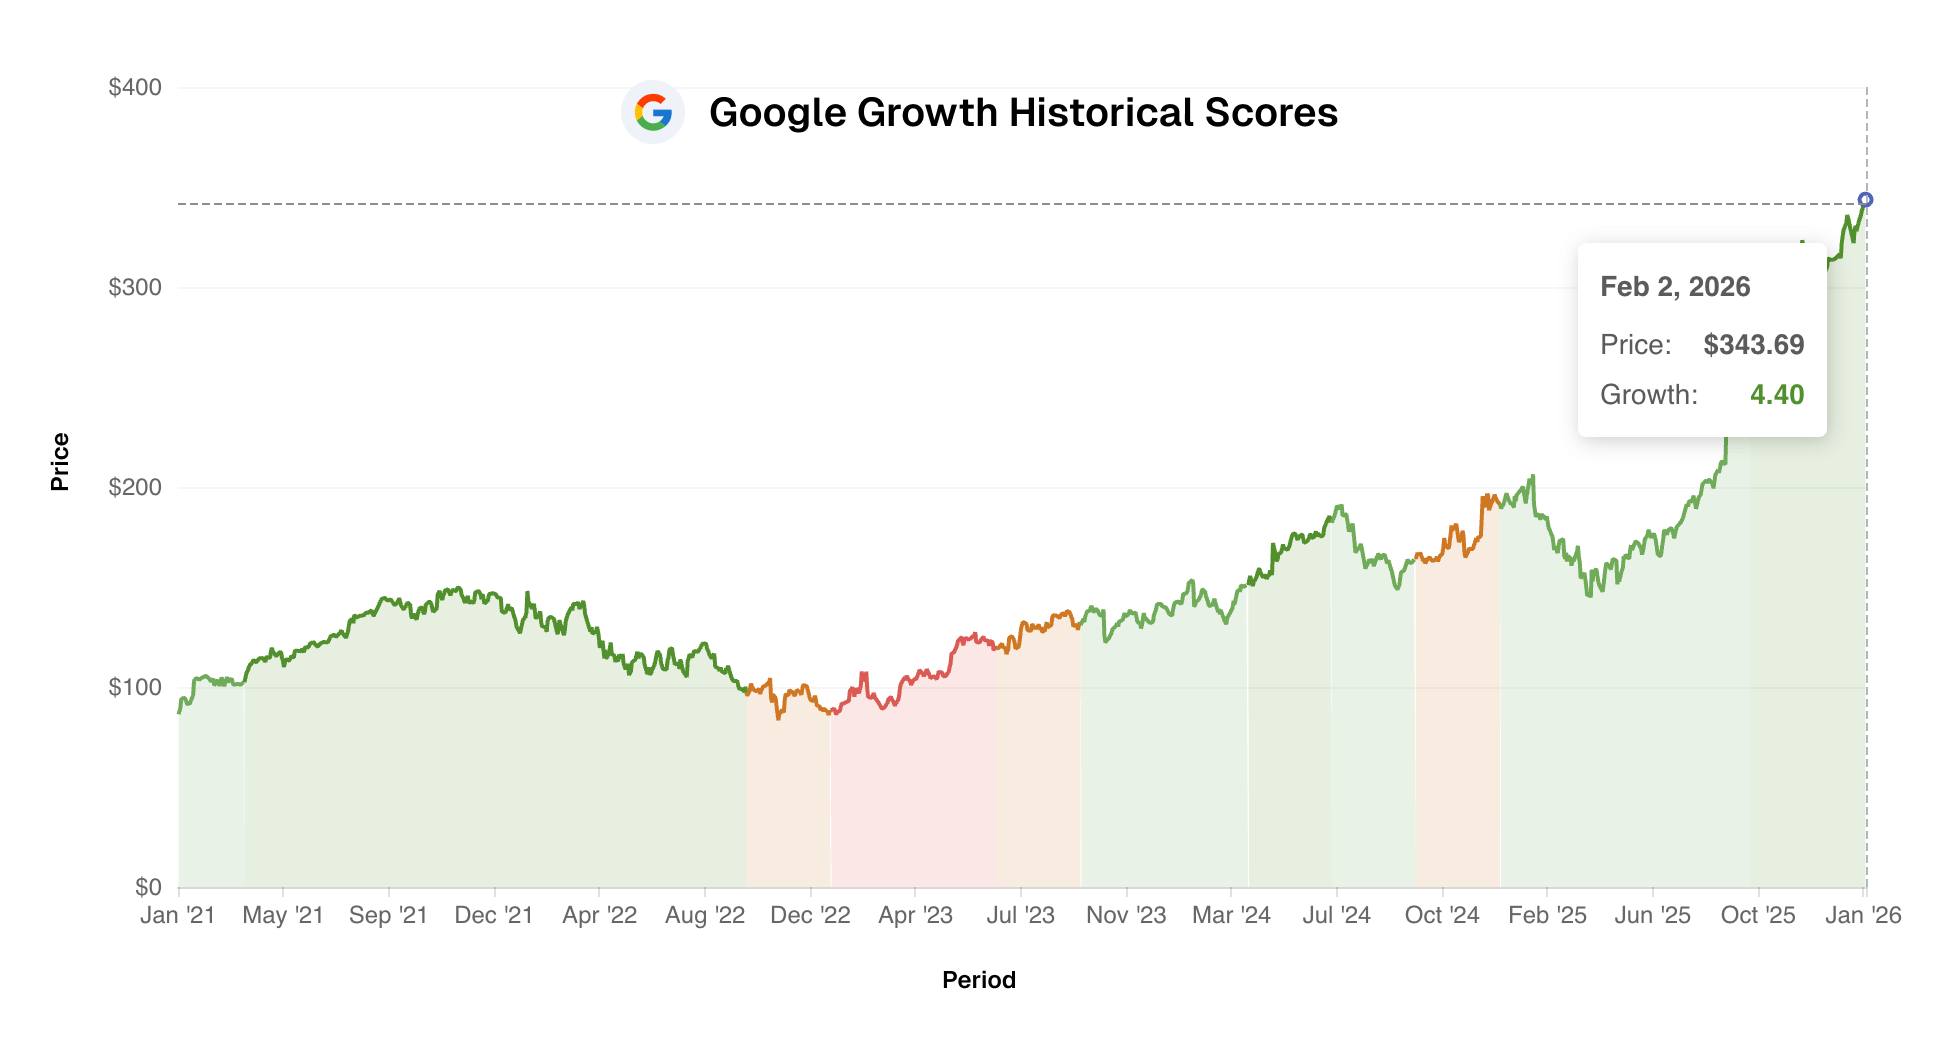
Strong vs. Slow Growth
Tracks revenue, earnings, and cash flow growth across multiple financial statements. For banks, we also factor in deposit and interest income trends. See how growth accelerated or stalled over time.
Profitability
High vs. Low Margins
Evaluates margins (gross, operating, net, and more) along with how efficiently the company converts revenue into cash. See how margin expansion and compression tracked against the stock price over time.
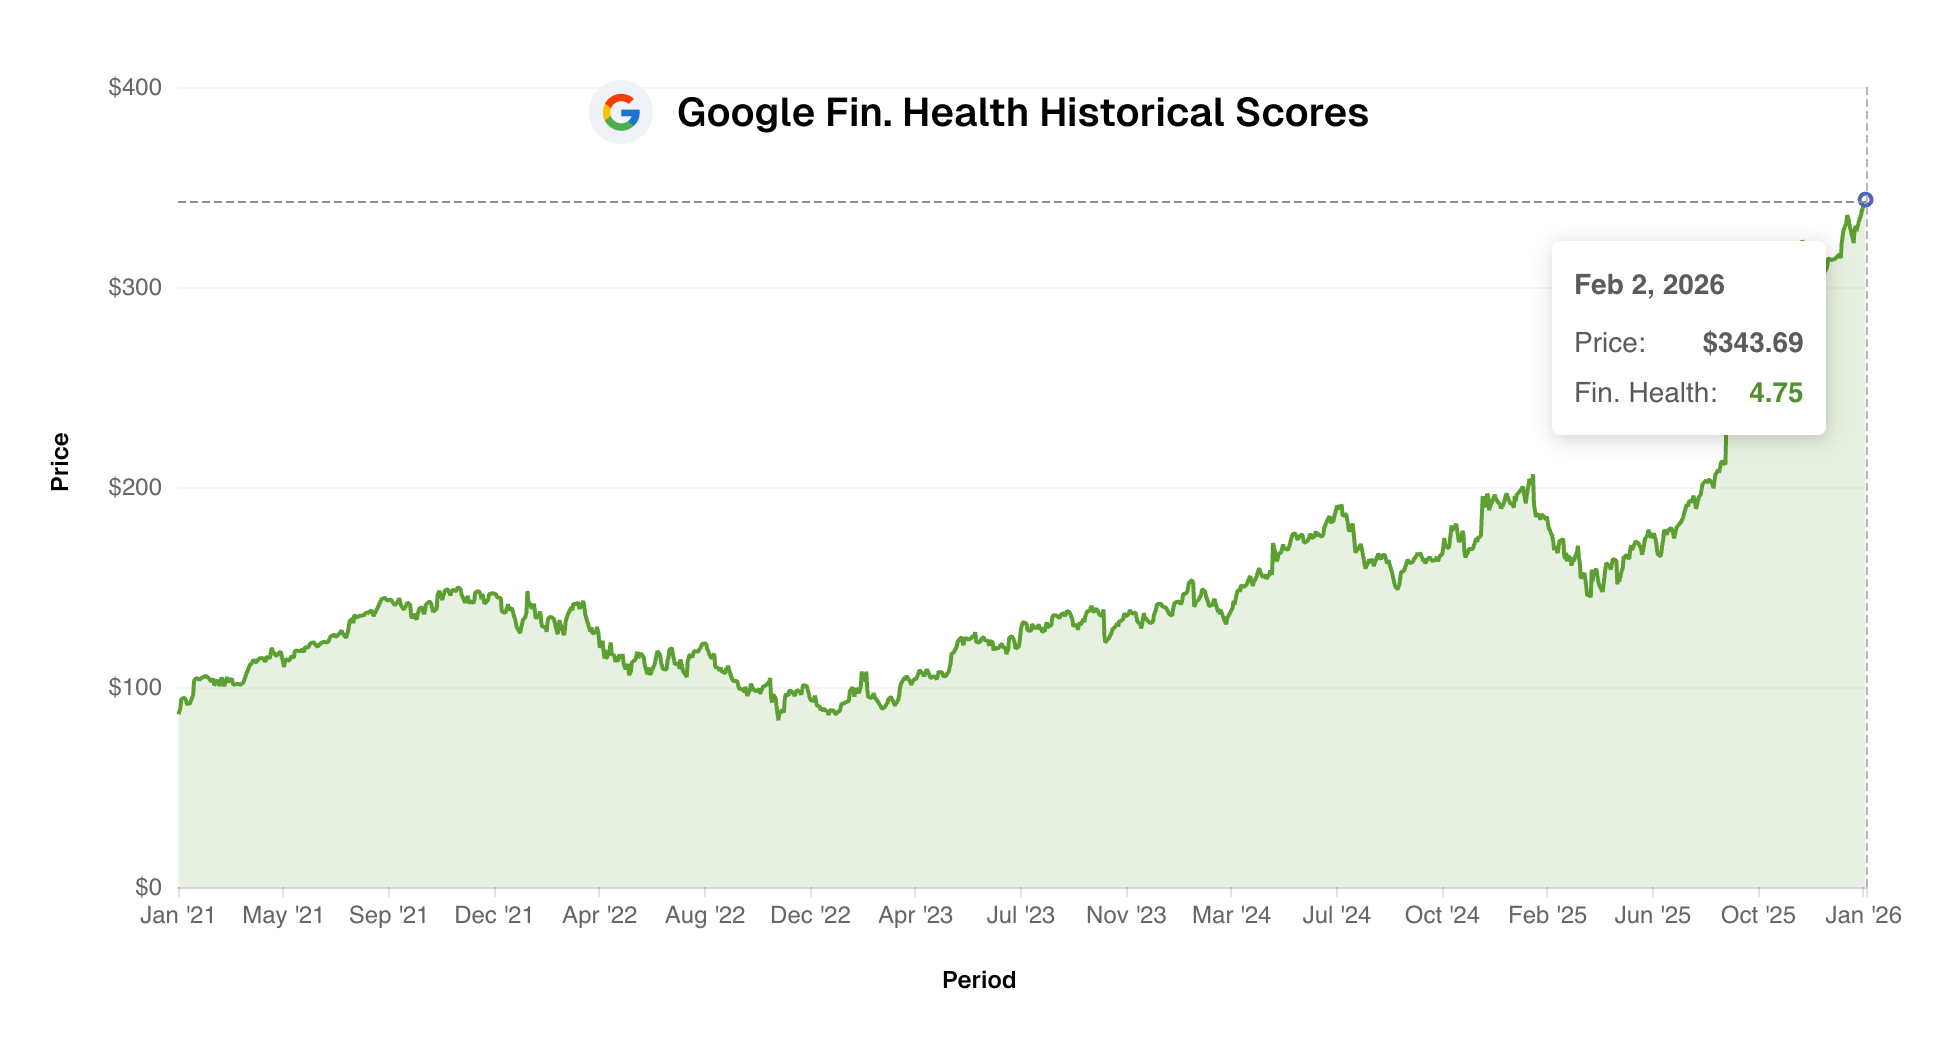
Financial Health
Strong vs. Weak Balance Sheet
Looks at leverage ratios like debt-to-EBITDA, returns on capital, and the overall cash position relative to liabilities. Watch how the balance sheet strengthened or deteriorated over the years.
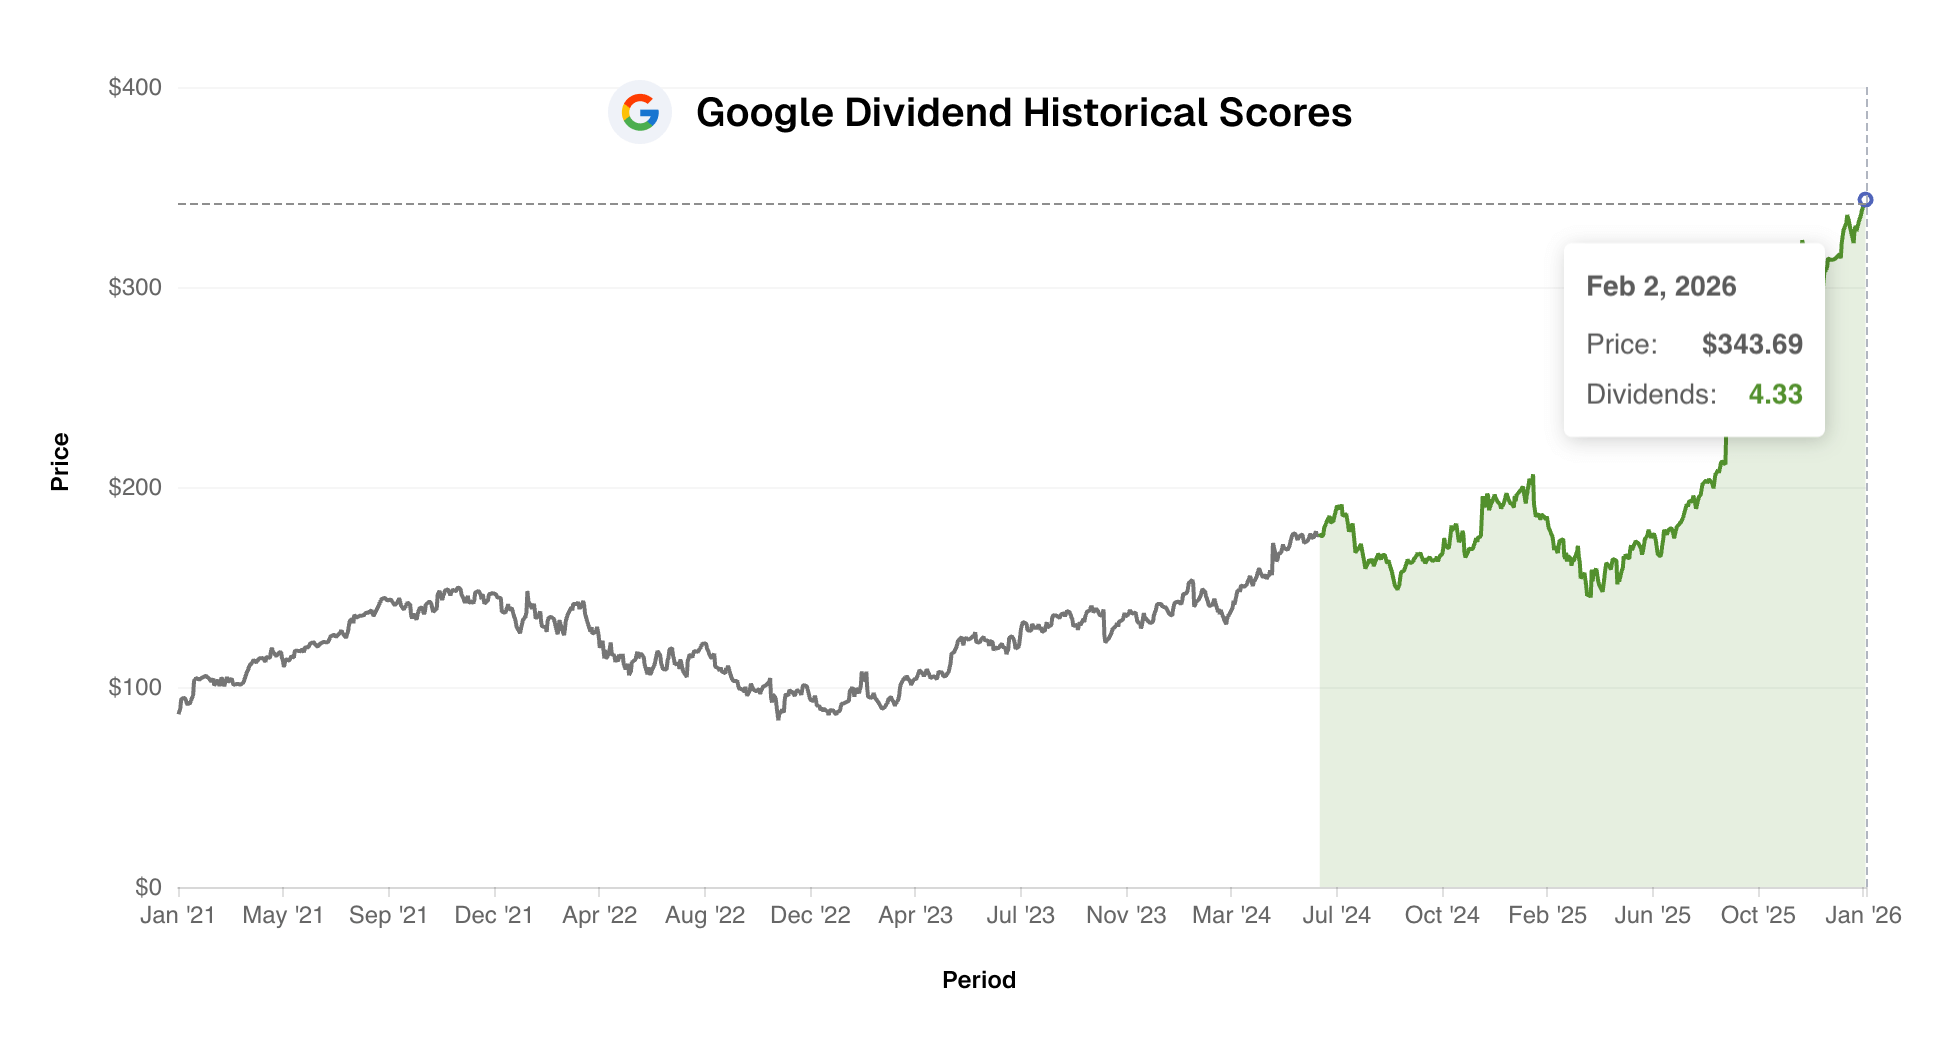
Dividends
Safe vs. At-Risk Payouts
Tracks dividend growth, payout ratios, and yield to gauge whether payouts are sustainable. For REITs, we also evaluate FFO-based metrics. See when payouts were sustainable vs. at risk.
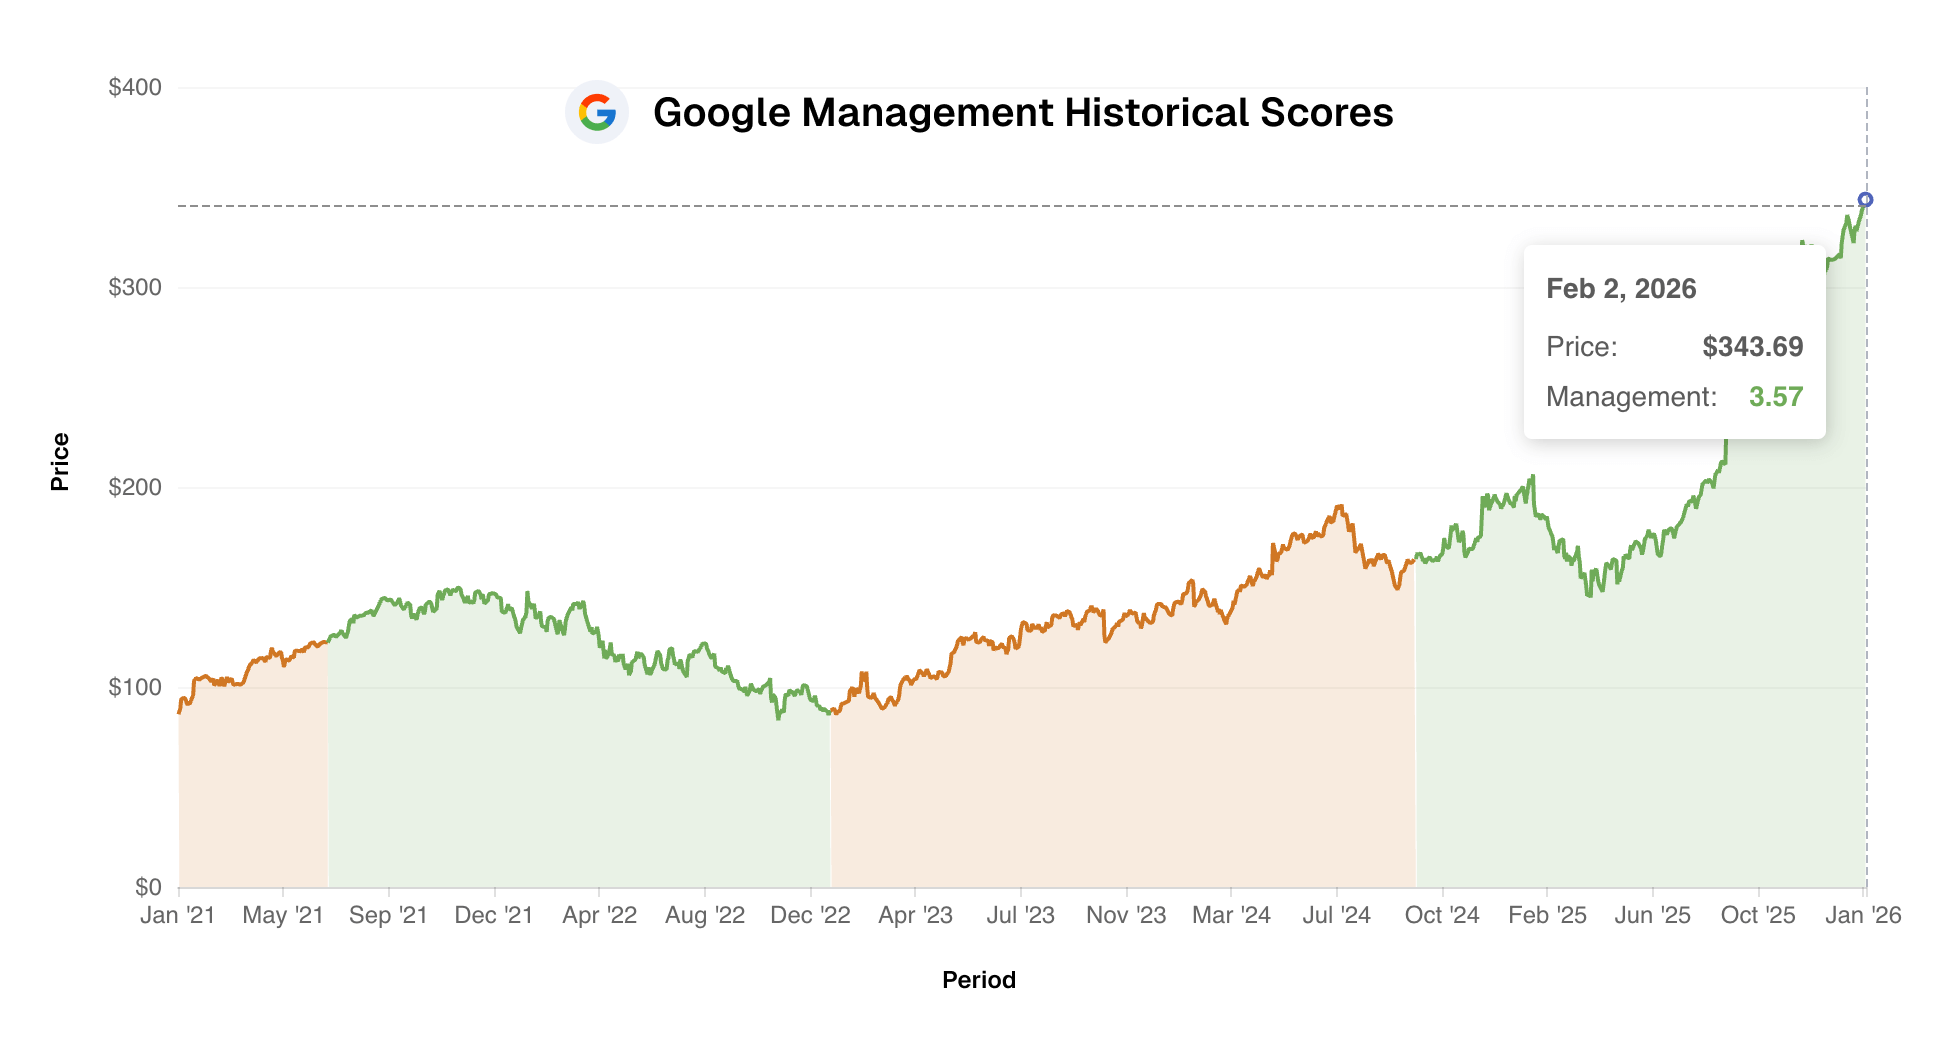
Management
Efficient vs. Inefficient
Compares shareholder returns against the S&P 500 over multiple time frames, factors in CEO-tenure performance, and checks whether stock-based compensation is getting out of hand. See when management was creating or eroding value.
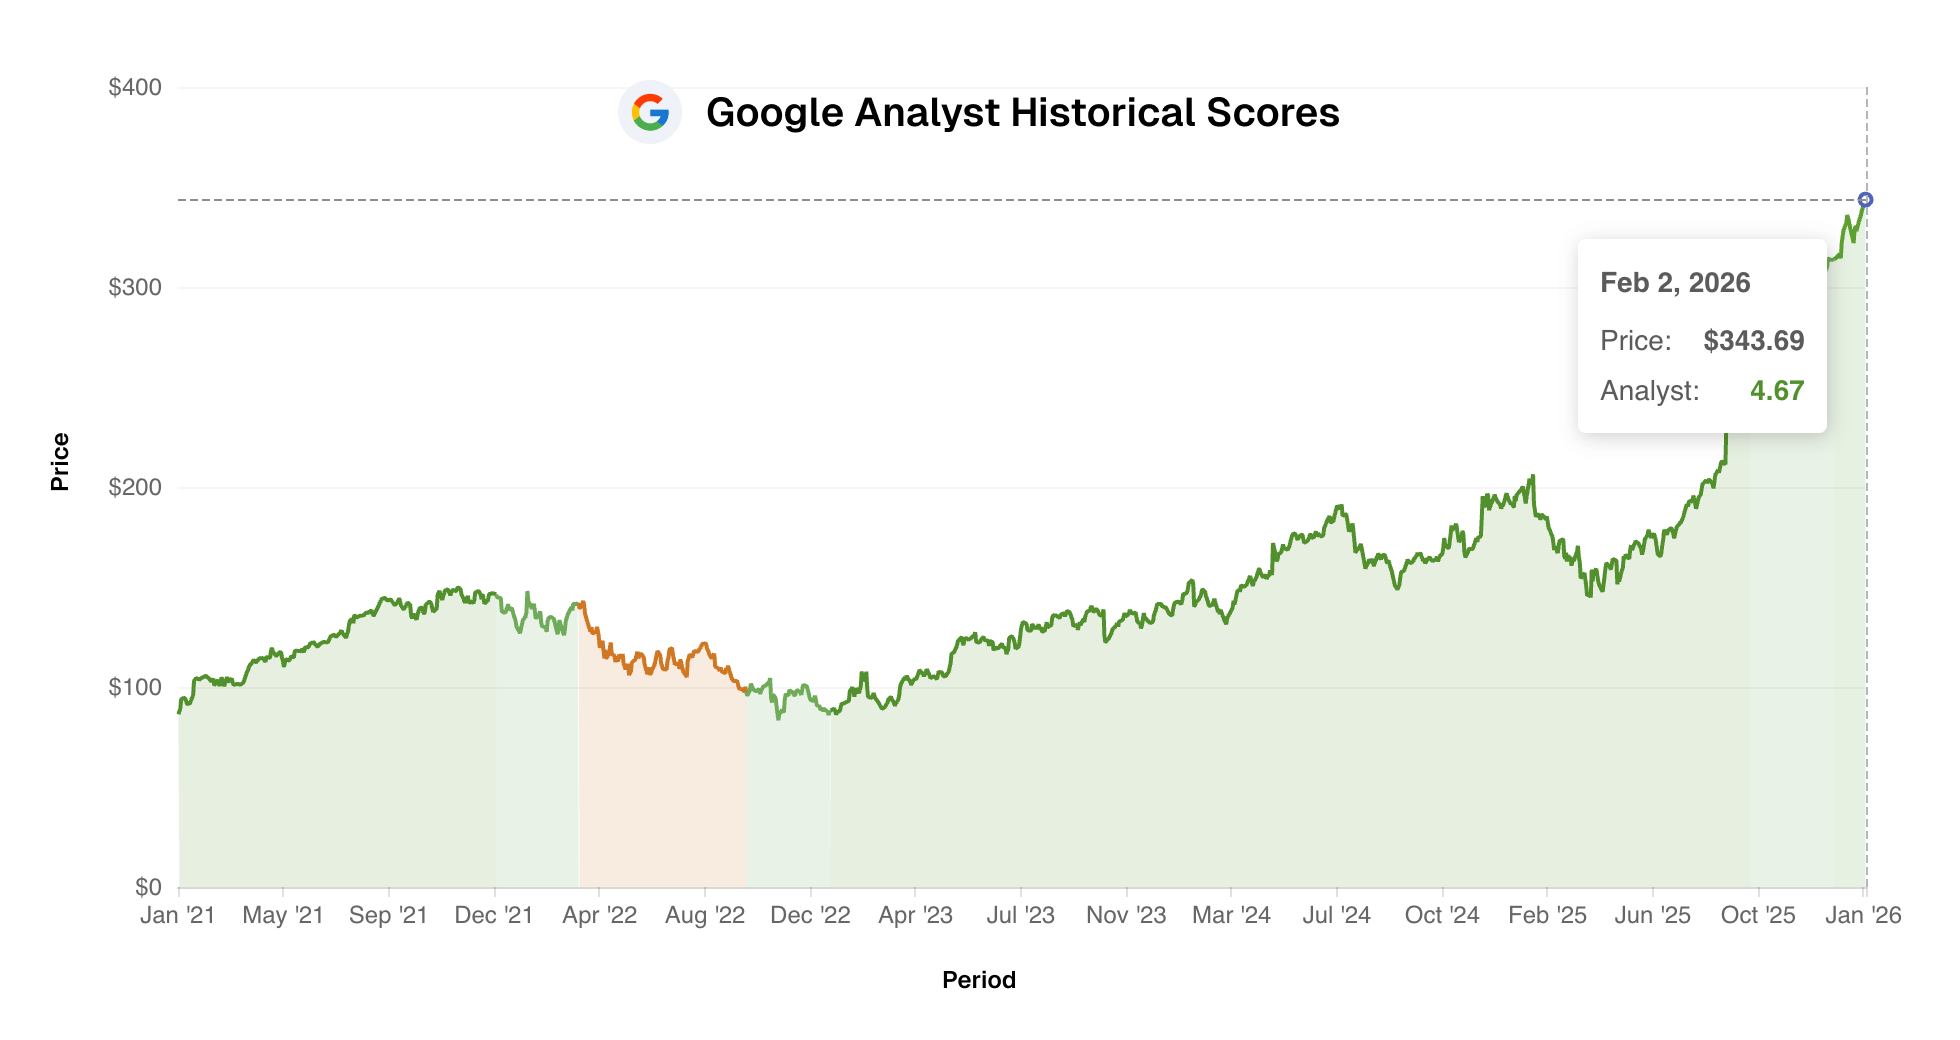
Analyst Forecasts
Bullish vs. Bearish Sentiment
Combines projected EPS and revenue growth with analyst ratings and price targets into a single sentiment picture. See how Wall Street sentiment evolved before and after major moves.
Explore the Valuation Score
Historical scores are for informational and educational purposes. Past score performance does not guarantee future results. Scores are not buy or sell recommendations.
See It In Action
Search for any stock and see how it scores across all 7 categories.
Common Questions About Historical Stock Scores
How our backtesting data works and what you can do with it
What are Historical Stock Scores?
Historical Stock Scores let you see how any stock scored at any point in the past, going back up to 35 years. You can watch how all 7 score categories evolved through market cycles, crashes, earnings surprises, and recoveries. It's like a time machine for fundamental analysis.
What is point-in-time accuracy?
Every historical score uses only data that was available at that exact moment. If you're looking at how a stock scored in March 2015, you see only what was known in March 2015. No future earnings, no revised financials, no hindsight. This is critical for honest backtesting, and most platforms don't do it.
How far back does the data go?
The data goes back up to 35 years depending on your subscription tier. Free users get a limited preview. Pro subscribers get 10 years of history. Unlimited subscribers get the full depth, with no restrictions.
Can I use this to backtest investment strategies?
That's exactly what it's built for. You can see when the Valuation Score flagged a stock as undervalued and watch what happened to the price afterward. You can track how fundamental scores shifted before major moves. The key difference is that our historical data has no look-ahead bias, so the backtest is honest. Stock Scores are for informational and educational purposes only, not buy or sell recommendations. Past performance does not guarantee future results.
Which score categories can I view historically?
All 7. You can view the overall score and each category individually: Valuation, Profitability, Growth, Financial Health, Dividends, Management, and Analyst. In the app, the Valuation Score gets its own dedicated chart alongside the other categories.
How do I read the historical charts?
The chart shows the score (1-5) over time overlaid with the stock price. When the score is high (green), the stock looked fundamentally strong at that moment. When it's low (red), there were concerns. You can zoom in on specific time periods and switch between categories to see different angles.
Is historical data available for all stocks?
Historical scores are available for approximately 40,000 stocks across 70+ global exchanges (out of the 100,000+ we score today). The depth of history varies by stock, as some companies have been public longer than others. Newer companies will naturally have shorter histories.
How is this different from just looking at a stock chart?
A stock chart shows you price. Historical Stock Scores show you fundamentals. You can see whether a stock was fundamentally strong or weak at any given price point. A stock might have been cheap at $50 in 2018 and expensive at $50 in 2022 because the underlying business changed. Price alone can't tell you that.
Still have questions?