
What Is a Good Free Cash Flow Yield? Value vs. Value Traps

By Brian McCormick ·

A 6% free cash flow yield can be attractive when a business generates dependable cash and has room to grow. A 12% yield can still be a poor deal if the cash flow is about to shrink. There is no percentage that makes every stock cheap.
A good yield needs to make sense for the cash the business can keep generating, its debt and the return you want to earn. Start with the reported number, then check what supports it.
Consider two companies whose shares are each worth $1 billion in total. Company A’s $60 million in annual free cash flow gives it a 6% yield, while Company B reports $120 million and a 12% yield. B appears cheaper, but we need to examine where its cash came from.
How to calculate free cash flow yield
Free cash flow, or FCF, is commonly calculated as the cash generated by operations minus spending on long-term assets such as equipment and buildings. That spending is called capital expenditure, or capex.
Free cash flow = operating cash flow − capital expenditures
FCF yield = annual free cash flow ÷ market capitalization × 100
Market capitalization is the market value of all the company’s outstanding shares.
For Company A, suppose operating cash flow is $100 million and capex is $40 million. That leaves $60 million in FCF:
$60 million ÷ $1 billion × 100 = 6%
The company generates $6 in annual FCF for each $100 of its shares’ market value. Shareholders do not necessarily receive that $6. Management can retain it, repay debt, buy back shares or pay dividends.
You can also express the price as a multiple. A 6% yield equals about 16.7 times annual FCF; a 12% yield equals about 8.3 times. The price-to-FCF multiple is the inverse of the yield expressed as a decimal.
Use a full year or the latest four quarters of cash flow to calculate a trailing yield. A forward yield uses a forecast. Multiplying one strong quarter by four can exaggerate cash generation in a seasonal business.
Check the calculation behind a company’s own FCF figure. The SEC notes that FCF has no uniform definition, so adjustments can differ between companies.
What makes a free cash flow yield good
Even a healthy company can be too expensive when its price leaves too little potential return for the risk you are taking.
Suppose Company A can generate $60 million every year indefinitely, after all necessary investment. It has no debt or other claims on that cash and pays all of it to shareholders. There is no growth in this simplified example.
At a $1 billion price, those annual payments provide a 6% cash return. If you require 8% instead, the same cash stream supports a lower price:
| Annual return you require | Price supported by $60 million a year |
|---|---|
| 6% | $1 billion |
| 8% | $750 million |
| 10% | $600 million |
Illustrative values for a flat annual cash stream paid at each year-end indefinitely. Price equals annual cash divided by the required return. These are assumptions, not market benchmarks.
Growth in cash flow can support a higher price, but the forecast needs to include the spending that makes that growth possible. Greater uncertainty may lead you to demand a higher return and pay less.
A 6% yield is more promising when cash flow per share can grow steadily than when the business must spend heavily just to stand still. Look for evidence supporting that growth, such as repeat sales, improving margins or investments already producing cash.
Why a yield can rise
A yield can rise because the business produces more cash or because its shares become cheaper.
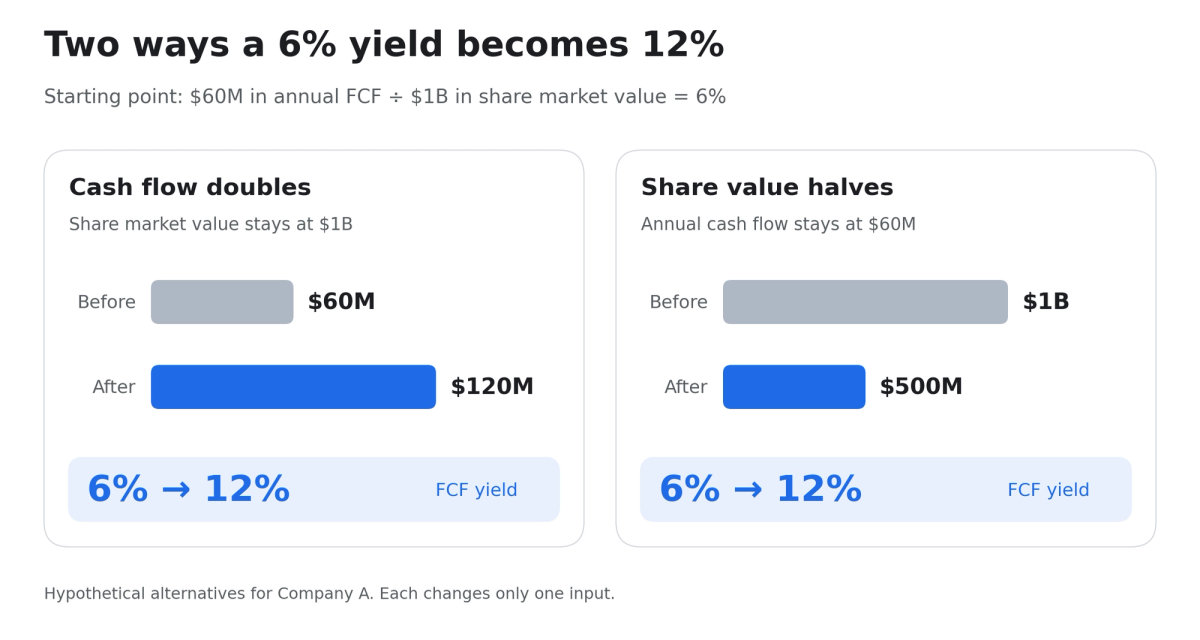
A falling share price may offer a bargain, but it can also reflect lost customers, shrinking demand or a product becoming obsolete. Last year’s cash flow may not show that damage yet.
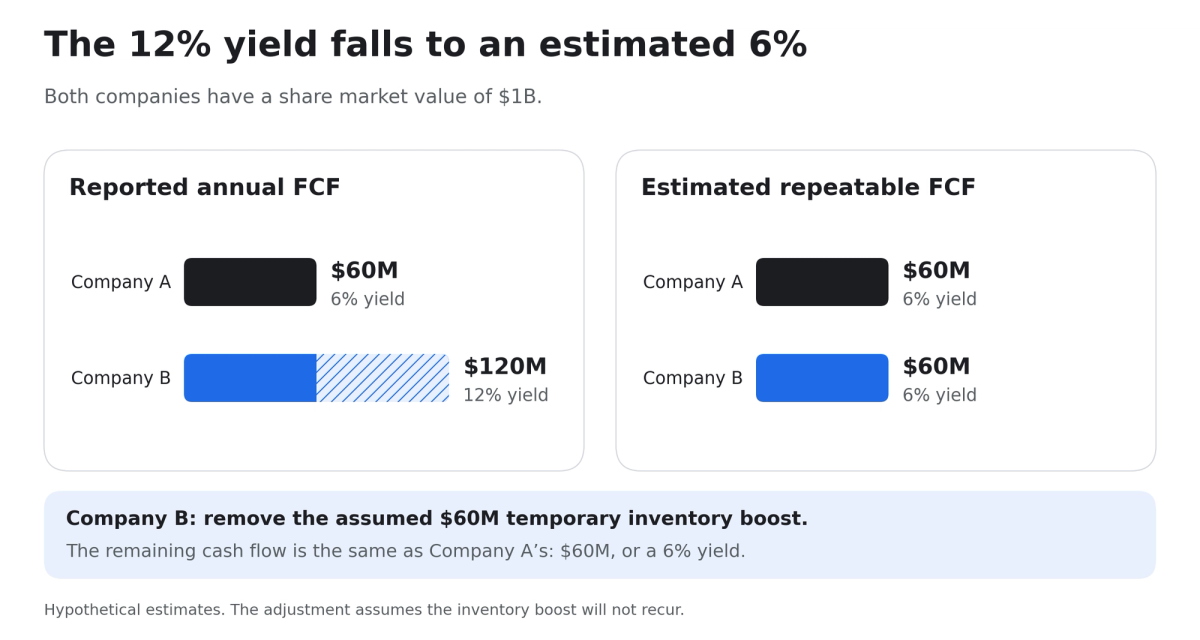
Removing the temporary boost leaves both businesses with an estimated 6% yield before considering differences in debt and future growth.
This estimate of repeatable cash generation is called normalized FCF. It requires judgment. Some changes, such as permanently better inventory management, improve the business even when the initial cash release does not repeat.
Accelerated customer collections, delayed supplier payments and unusually low cash taxes can also lift a single year’s number. Several years of cash flow, alongside management’s explanation of the changes, help you judge which benefits can continue.
Check debt before choosing between the stocks
B also has $200 million of debt in this example, with $40 million of principal due next year. A has no debt.
If B generates the estimated $60 million of repeatable FCF, paying that principal leaves $20 million before other uses. A has no equivalent debt repayment.
Conventional FCF usually does not deduct principal repayments. For companies reporting under U.S. GAAP, cash interest paid generally already reduces operating cash flow; principal repayments usually appear under financing activities. The SEC cautions that reported FCF may exclude mandatory cash obligations.
Repaying debt can benefit shareholders by reducing what B owes, although cash spent on repayment is unavailable for a dividend or an acquisition. Refinancing may preserve cash, but new borrowing has to be available on acceptable terms.
With no repeatable cash-flow advantage and a debt payment approaching, B looks less attractive than its 12% headline yield suggests. A has more financial flexibility, although it still needs enough growth, or a lower price, to meet your required return.
Check reinvestment and cash flow per share
Separate necessary upkeep from expansion. Replacing worn equipment keeps a business operating; building another factory aims to expand it. Both use cash, and postponing maintenance can make reported FCF look better without improving the business.
Companies do not always disclose maintenance spending separately. Before adding back spending described as growth investment, consider whether the business could stop it without losing sales. Your growth forecast may also depend on that investment continuing.
Allow for the business cycle. An oil producer’s cash flow during unusually high oil prices may be far above what it can earn through a full cycle. Estimate typical cash flow from several years, allowing for changes in the business, and divide it by today’s market value. Averaging old yields mixes past cash flow with past prices.
Include the cost of stock-based compensation. Paying employees in shares conserves cash, but it has an economic cost. Noncash stock compensation is added back in the indirect operating cash-flow calculation. New shares dilute existing owners unless buybacks offset them, and those buybacks cost cash.
A 10% increase in Company A’s FCF leaves FCF per share unchanged when its share count also rises 10%. Alongside the share count, check how much repurchasing merely offsets shares issued to employees. The CFA Institute’s valuation guidance explains how financing and share issuance affect cash-flow valuation.
Microsoft shows what a low yield asks investors to believe
Microsoft’s fiscal 2025 cash flows:
| Cash flow measure | FY2024 | FY2025 |
|---|---|---|
| Operating cash flow | $118.55 billion | $136.16 billion |
| Cash additions to property and equipment | $44.48 billion | $64.55 billion |
| Calculated FCF | $74.07 billion | $71.61 billion |
Source: Microsoft’s 2025 annual report. Years ended June 30. FCF is operating cash flow minus cash additions to property and equipment; calculations use unrounded figures.
Operating cash flow rose about 15%, but higher capital spending pushed FCF down about 3%.
At the June 30, 2025 closing price of $497.41, the 7.434 billion shares reported outstanding imply a market capitalization of about $3.70 trillion. Dividing $71.61 billion by that value gives an FCF yield of about 1.9%. This is a retrospective calculation using year-end financial results reported afterward.
At an unchanged market value, doubling annual FCF would produce a yield of about 3.9%. A low-yield valuation can depend heavily on future growth. Investors must assess whether new spending will produce enough additional cash, how long that will take and what further investment it requires.
Compare the yield with realistic alternatives
Compare companies with similar business models, growth prospects and financing. A software company and an oil producer can reasonably trade at different yields.
An unusually high yield relative to the company’s own history may reflect a better price or a worse business. Its financial results can help you distinguish between them.
If a Treasury offered 4%, a stock with a 6% FCF yield would not automatically be the better investment. The stock’s FCF can fall and may never be paid out as a dividend. Your return also depends on how management uses the cash and the price at which you sell.
Before calling a stock cheap, write down the annual FCF you expect it to sustain, the obligations that claim that cash and the growth you expect per share. Calculate the yield at today’s price. Then repeat with a less favorable cash-flow estimate to see how much your conclusion depends on being right.
Common questions about free cash flow yield
Is a 6% free cash flow yield good?
Dependable cash generation, manageable obligations and growth can make a 6% yield attractive. You are paying about 16.7 times annual FCF. Without growth, the yield may be insufficient for an investor who requires a higher return.
Is a 10% free cash flow yield good?
A 10% yield means paying 10 times annual FCF. It can be attractive if that cash is repeatable and the business remains healthy. Check whether the yield reflects a temporary cash boost, peak profits or a falling share price that anticipates deterioration.
Can free cash flow yield be negative?
Operations may consume cash, or capital spending may exceed operating cash flow, leaving negative FCF. Find out why, and whether the company can fund itself until cash generation improves.
Is FCF yield the same as dividend yield?
Dividend yield measures payments to shareholders relative to the share price. FCF yield compares business cash generation with valuation, including cash that management may retain or use for other purposes.
Should I use market capitalization or enterprise value?
This article uses operating cash flow minus capex, divided by market capitalization. An enterprise-value yield typically uses unlevered FCF, which measures cash flow before payments to debt providers. Match the cash-flow measure to the valuation measure; changing only the denominator does not make the two yields comparable. See the CFA Institute’s explanation of cash flow to the firm and to equity.
Does FCF yield work for banks and insurers?
The simple calculation is more useful for nonfinancial operating businesses. Banks and insurers need analysis tailored to lending, reserves and regulatory capital. Avoid applying the same screening thresholds across all sectors.
See whether the price makes sense
Start with a stock you’re considering. Stock Unlock loads its financial history so you can test how cash-flow growth and your required return change the price you could justify.