
Find Stocks That Look
Cheap for Their Growth
Plot P/E against projected EPS growth, or any two of 104 metrics, for up to 1,000 stocks. Median lines split the chart into four, so the stocks worth a closer look stand out in seconds.
Free template, no account needed
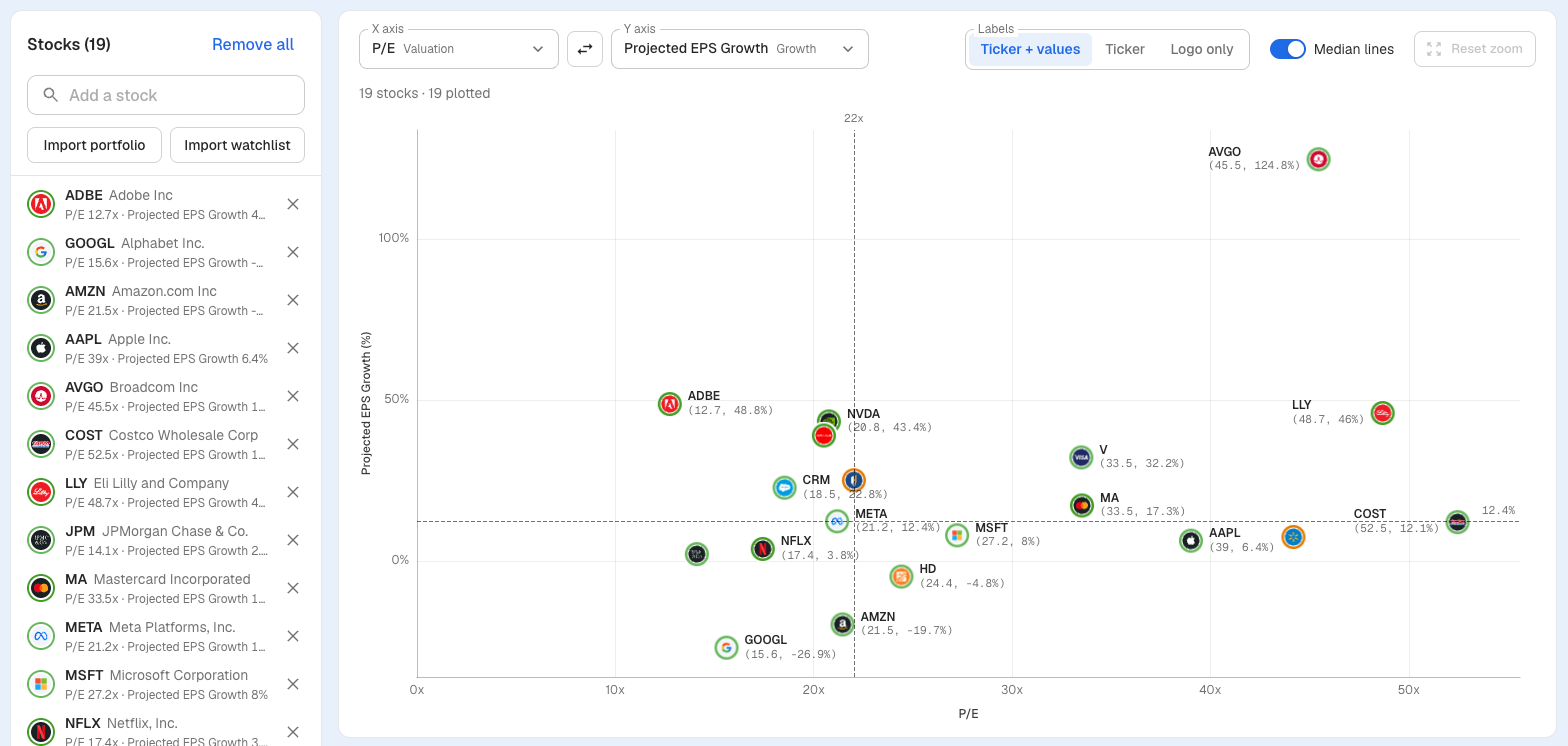
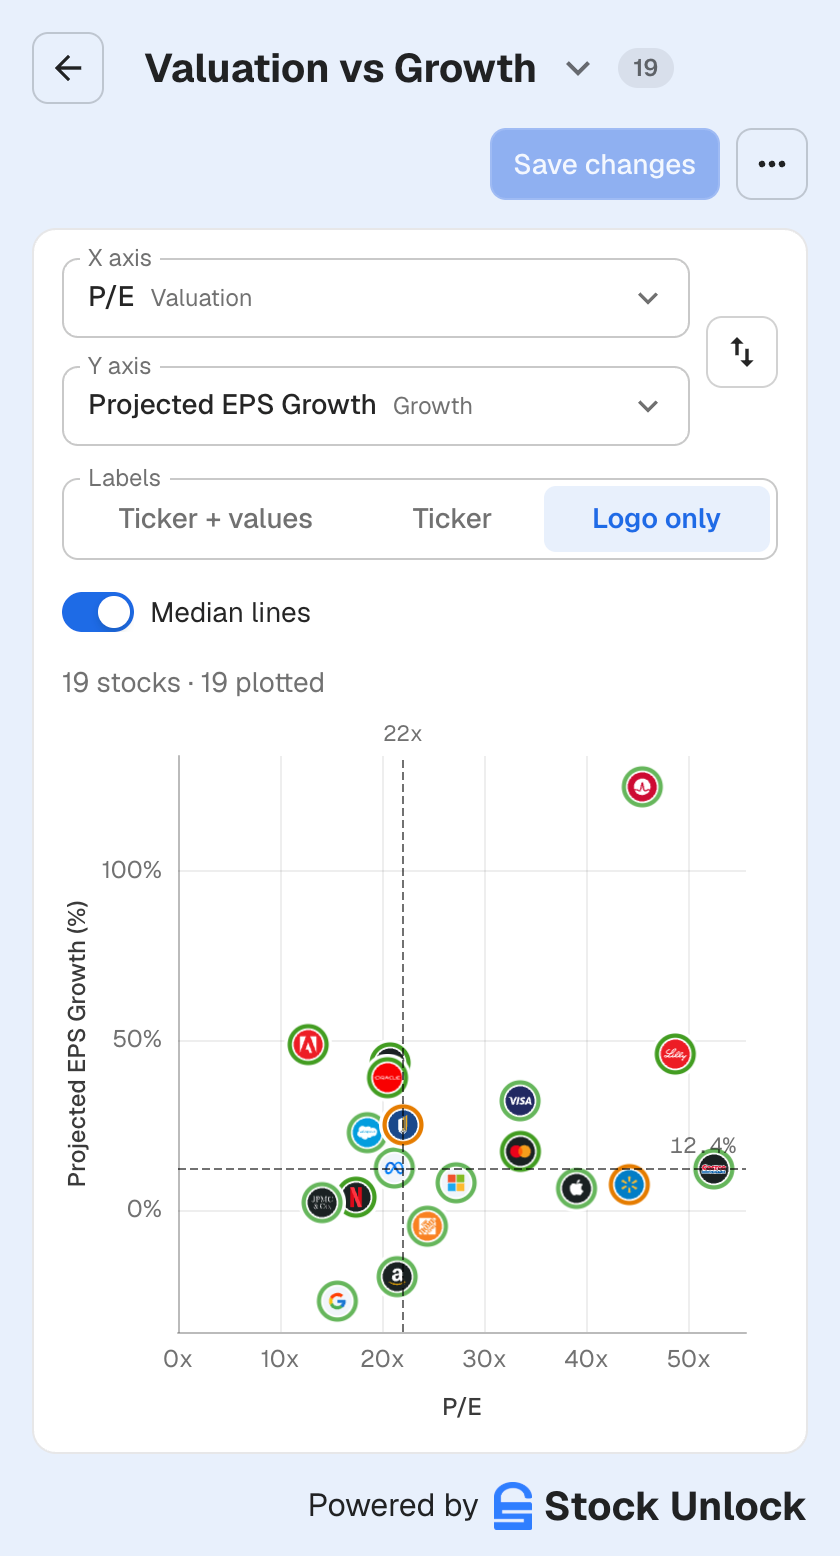
P/E vs Projected EPS Growth for large-cap US stocks. Values as of November 2026. Not a recommendation.
Dot Charts vs Stock Comparison
Stock Comparison is where you go to compare or look at the historical financials, price ratios, margins, and more for one or more stocks. Dot Charts is where you go to plot many stocks against one another, using two different metrics on the Y and X axis. It helps you quickly identify the value vs growth of the stocks.
Stock Comparison
GOOGL vs MSFT · Revenue over time
- Historical financials, price ratios, margins, and more
- One stock on its own, or a few side by side
- See Stock Comparison
Dot Charts
500 stocks · P/E vs Projected EPS Growth
- Many stocks plotted against one another
- One metric on the Y axis, one on the X axis
- Quickly identify value vs growth
Two Metrics. Your Stocks. One Chart.
Three steps, no spreadsheet.
Pick your axes
Choose from 104 metrics in 10 categories, from P/E and PEG Ratio to ROIC, Dividend Yield and Stock Scores. Search, or start from Popular.
Add your stocks
Search for tickers, or import a portfolio or watchlist in one click. Up to 1,000 stocks per chart.
Read the chart
Turn on median lines, switch labels, drag to zoom on a computer, and click any dot to see its numbers and open the stock.
Any Two Metrics. Up to 1,000 Stocks.
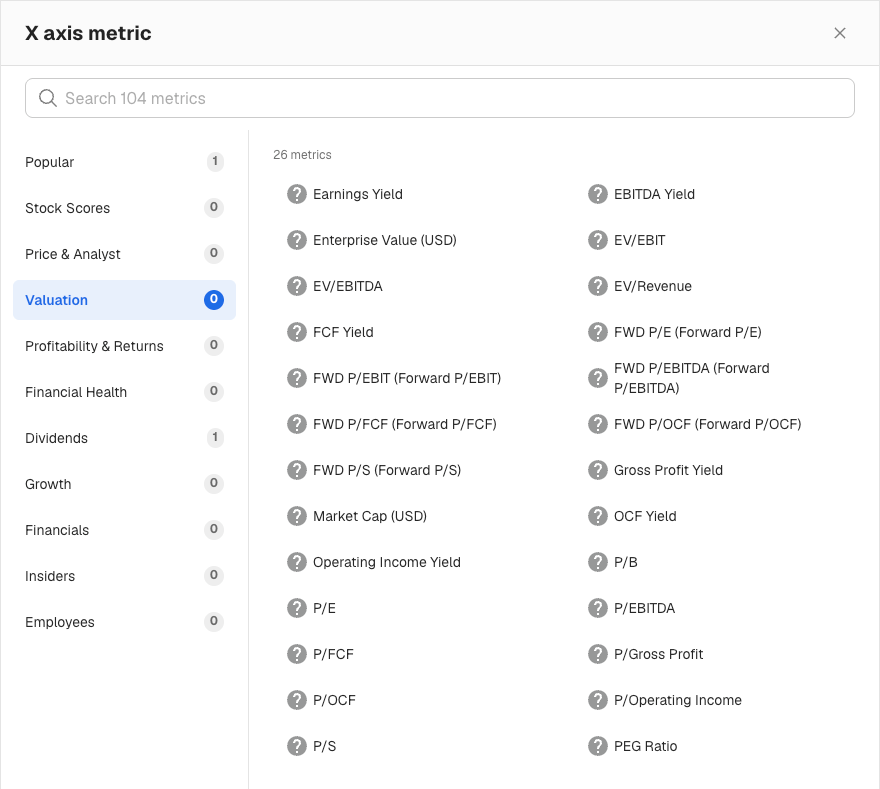
Put the numbers you already invest by on the axes. Every metric comes from the same data that powers our Stock Screener, which covers 100,000+ stocks across 70+ exchanges.
- 26 valuation metrics, including P/E, Forward P/E, PEG Ratio, P/FCF and EV/EBITDA
- Growth, profitability, financial health, dividends, the Overall Score and all 7 Stock Score categories
- Swap the axes in one click
Medians Split the Chart Into Four
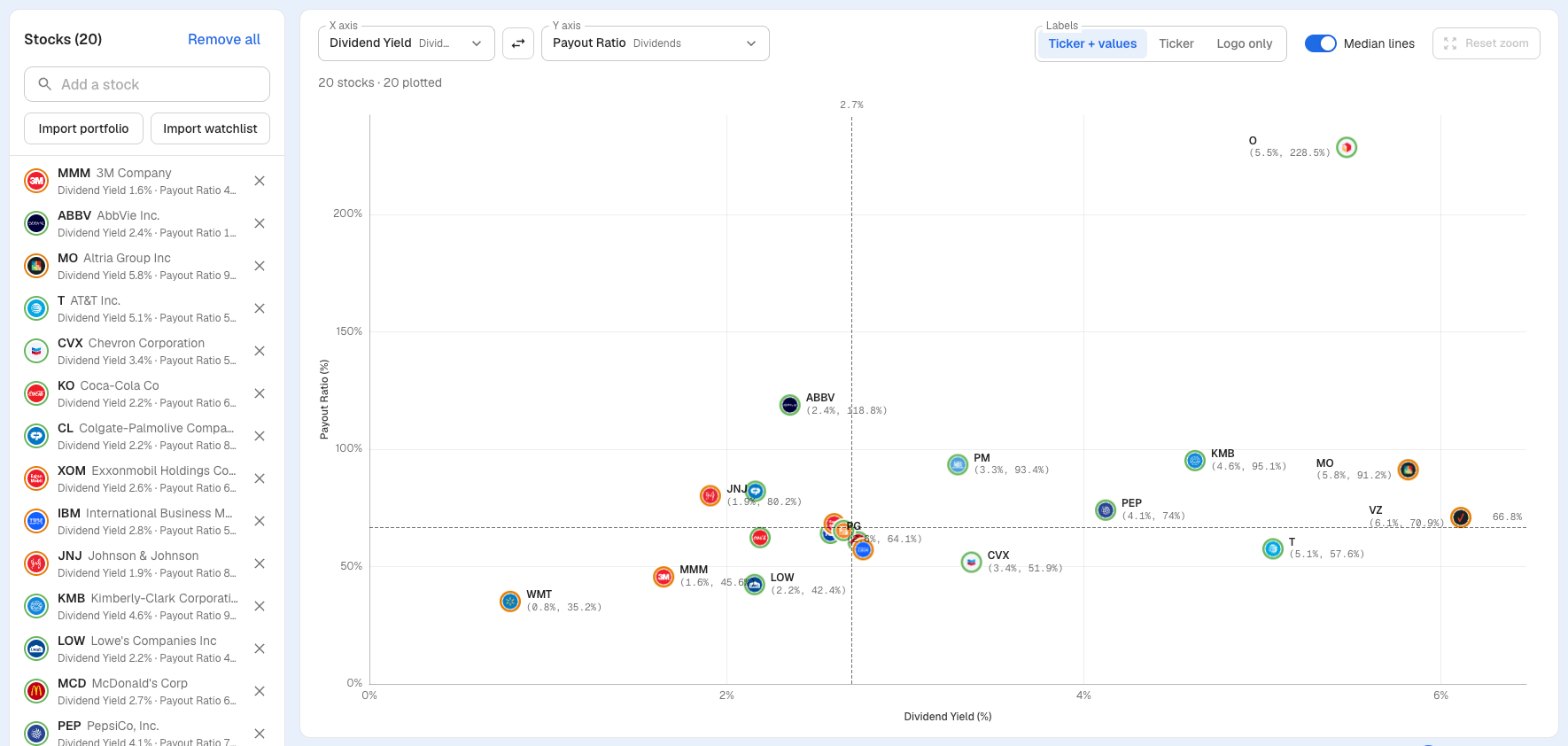
Turn on median lines and every stock lands in one of four groups. On Dividend Yield vs Payout Ratio, the bottom right holds stocks paying an above-median yield while paying out less of their earnings than the median.
- Labels show Ticker + values, Ticker alone, or Logo only. Charts with up to 50 plotted stocks show values by default
- Each dot is ringed in the color of its Overall Stock Score
- On a computer, drag across the chart to zoom in, then reset in one click
Import stocks
24 tickers selected
Only stocks are added. ETFs, funds and cash are skipped.
Illustrative example.
Your Portfolio on One Chart
Import a portfolio or a watchlist and see every holding on the same two metrics. It's a quick way to spot the stock that no longer fits your rules.
- Import any portfolio or watchlist, or add tickers one at a time
- Only stocks are added. ETFs, funds and cash are skipped
- Stocks without a value for a metric are listed as not plotted, with the reason
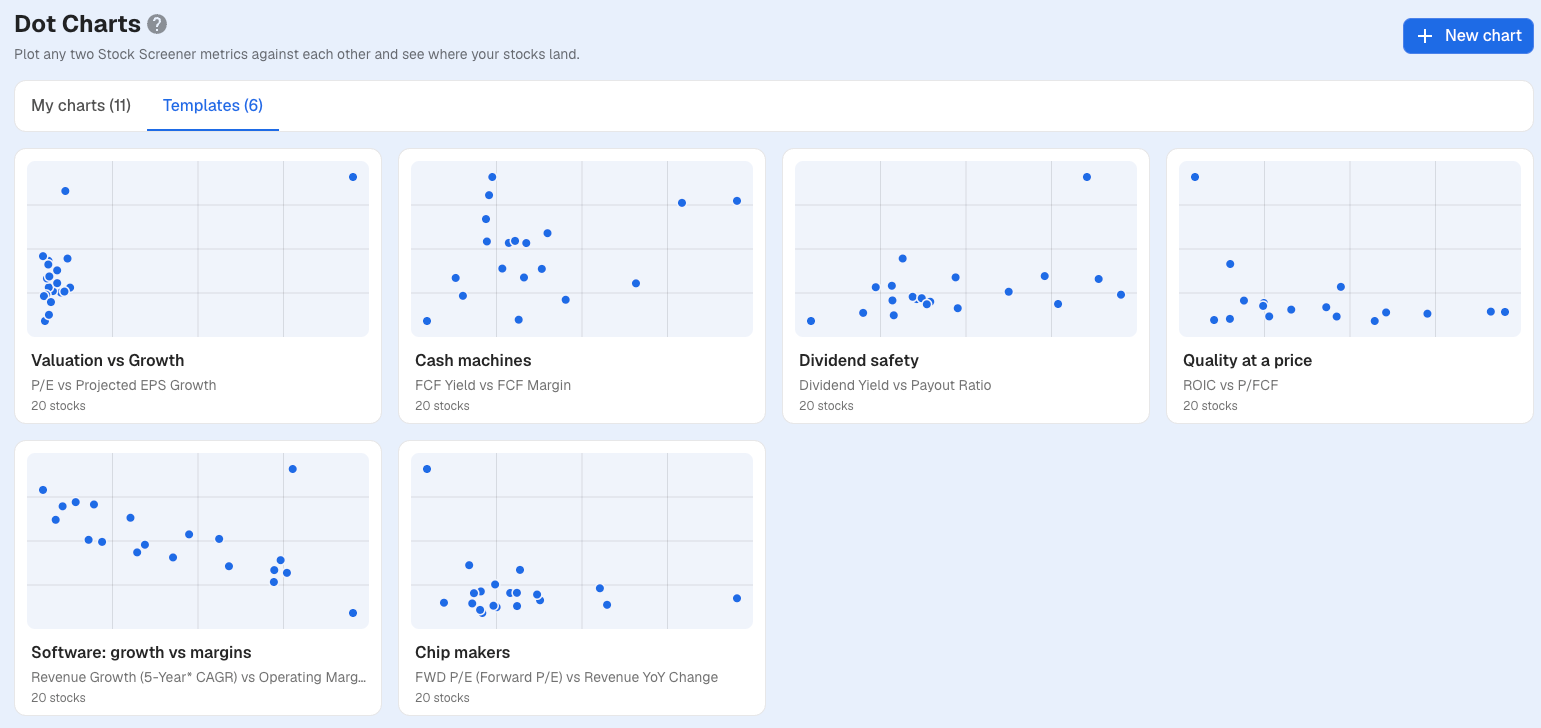
Start From a Template
Six ready-made charts cover common questions. Open one, change the metrics or the stocks, and save it as your own.
- Valuation vs Growth is free for everyone, no account needed
- Pro and Unlimited open all six and save their own versions
- Each template starts with 20 well-known stocks
Six Charts to Start With
Each template pairs two metrics that tell you more together than apart.
Valuation vs Growth
FreeP/E vs Projected EPS Growth
Spot stocks that look cheap for their growth.
Cash machines
Pro & UnlimitedFCF Yield vs FCF Margin
Find businesses that turn a large share of sales into free cash flow, and see what you pay for that cash.
Dividend safety
Pro & UnlimitedDividend Yield vs Payout Ratio
Weigh what a dividend pays against how much of earnings it uses up.
Quality at a price
Pro & UnlimitedROIC vs P/FCF
See whether high returns on capital come with a high price.
Software: growth vs margins
Pro & UnlimitedRevenue Growth (5-Year CAGR) vs Operating Margin
Compare how fast software companies grow with how profitable they are.
Chip makers
Pro & UnlimitedForward P/E vs Revenue YoY Change
Line up chip makers' valuations against their latest year-over-year revenue growth.
Charts Worth Building
You know your strategy better than we do. Here are some starting points, depending on how you invest.
Value investors
P/E vs Projected EPS Growth
With median lines on, the top left holds stocks with a below-median P/E and above-median expected growth.
Value investors
P/FCF vs ROIC
Check whether the businesses earning the best returns on capital still trade at a sensible multiple of their free cash flow.
Value investors
Valuation Score vs Overall Score
See which stocks score well on value and on overall quality at the same time.
Dividend hunters
Dividend Yield vs FCF Payout Ratio
A high yield paid from a small share of free cash flow sits in the bottom right.
Short on time
Overall Score vs P/FCF on your watchlist
Import a watchlist once and see quality against price for every stock on it in one look.
Portfolio check
Debt To EBITDA vs Interest Coverage
Find the holdings carrying the most debt relative to what they earn.
Free to Look. Pro to Save.
Everyone can open the Valuation vs Growth template, no account needed. Plans differ in how many charts you can save.
Free
1
free template, view only
Pro
2
saved charts
Unlimited
∞
no limit
Pro and Unlimited open all six templates and build charts from scratch with any two metrics and up to 1,000 stocks.
Downgrading never deletes a chart. On Pro, your 2 oldest charts stay open and the rest lock until you delete one or upgrade. On Free, saved charts stay locked until you upgrade.
Frequently Asked Questions
Common questions about Dot Charts
How do I find stocks that look cheap for their growth?
Open the free Valuation vs Growth template, which plots P/E against Projected EPS Growth for 20 large caps, and turn on median lines. Stocks in the top left have a below-median P/E and above-median projected EPS growth. Treat that as a starting point for research, not a verdict: check why the market prices a stock that way before you decide.
What is a dot chart?
A scatter chart of two metrics you pick. Each dot is a stock, placed by its latest value on the X axis and the Y axis, so you can compare a whole list of stocks at once instead of one at a time.
Which metrics can I chart?
104 metrics in 10 categories: Stock Scores (8), Price & Analyst (10), Valuation (26), Profitability & Returns (16), Financial Health (8), Dividends (7), Growth (16), Financials (6), Insiders (1) and Employees (6). Popular picks include P/E, Forward P/E, PEG Ratio, P/FCF, FCF Yield, Dividend Yield, Projected EPS Growth, Revenue YoY Change, ROIC and Gross Margin.
How many stocks can one chart hold?
Up to 1,000. Charts work on any stock in our Stock Screener, which covers 100,000+ stocks across 70+ exchanges.
Can I chart my portfolio or watchlist?
Yes. Import any portfolio or watchlist in one click, or add tickers one at a time. Only stocks are added; ETFs, funds and cash are skipped.
Can I chart ETFs?
No. Dot Charts shows stocks only. To compare ETFs, try the ETF Screener.
Why are some of my stocks not plotted?
A stock needs a value for both metrics to appear on the chart. Stocks without one are listed as not plotted, with the reason, for example when a value isn't available or a ticker isn't a stock.
What do the colored rings around each dot mean?
The ring shows the stock's Overall Stock Score: green is strong, red is a reason to look closer. Stocks without a score get a neutral ring. Learn how Stock Scores work.
What can I do for free?
Anyone can open the Valuation vs Growth template, no account needed. It's view only. Pro saves up to 2 charts of your own and Unlimited has no limit. Pro and Unlimited can also open all six templates and build charts from scratch.
What happens to my charts if I downgrade?
Nothing is deleted. On Pro, your 2 oldest charts stay open and the rest lock until you delete one or upgrade. On Free, saved charts stay locked until you upgrade.
Is Dot Charts in the mobile app?
No. Dot Charts is web only for now, and it works in your phone's browser too.

